IDEAWORKS EPIC Case Study: A Performance Comparison Between AC vs. DC LED Lighting Systems
Nov 1, 2019
As part of an Ontario Centres of Excellence (OCE) project, iLLUMA-Drive partnered with Mohawk College to compare a traditional AC LED lighting system to the CENSE DC system. Students working at the Energy and Power Innovation Centre, built a test bed including two setups: (1) a CENSE unit powering LEDs and (2) the conventional AC powered LED bulbs with converters. The test bed was designed to calculate and compare values, including converter/controller efficiency, light efficacy, and light flickering.
This research was completed by Mohawk between July and September 2018.
A Performance Comparison Between AC vs. DC LED Lighting Systems:
The motivation behind this project is to analyze the performance of DC powered LEDs vs AC powered LEDs. The iLLUMA-Drive company has provided their DC-DC converter, the CENSE unit, which will allow a 48V DC programmable power source to be used to run the LEDs. Powering the lights with DC instead of AC can also decrease light flickering. This is with respect to the quality of the DC output from traditional LED rectifiers that could vary depending on manufacturer quality as well as the converter technique used to produce the DC signals. In addition, a DC lighting system can potentially be more enegy efficient if integrated to a DC-based source such as solar PV, which also results in a zero carbon emission solution
This project will provide data for the efficiency of both types of power, DC and AC. Thus, input power, output power, and light output in lumens will be measured. Then, the efficiency of the LED driver on the AC side and the efficiency of the DC CENSE unit will be calculated. Also, the light quality will be monitored via a lux sensor and microcontroller that will plot the light output on a graph. This graph will sample the light output of the LEDs multiple times a second to show any flicker or change in light output.
These tests and results will be shown in the rest of the report in further detail. The measurement of power, LED driver efficiency calculations, and flicker monitoring are included.
2 Background
Traditional Light Emitting Diode (LED) lighting systems use AC power from the grid to produce light. As an LED light itself is a DC device, the incoming AC from the grid needs to be converted into DC through a power converter (rectifier). This additional power converter cause some power losses which is multiplied by the total number of LED lights that can be found in a typical North American residential unit.
With the push towards green technologies such as solar panels and wind generators it is forward-thinking to look at the possibilities of natural DC power in homes as opposed to AC grid power. Since LEDs operate on DC, it is intuitive to remove the AC/DC converter found in existing LED light bulbs, thus eliminating the source of power loss and increasing overall system efficiency.
2.1 Light Efficacy
This project focused mainly on two types of LED bulbs – a high efficacy LED light bulb and a traditional 10W LED light bulb. Luminous efficacy is a measure of a light bulb’s efficiency, i.e. how much electrical energy is converted into light and it is measured in lumens per Watt. An ideal light bulb that has a 100% efficiency would have an efficacy of 683 lm/W [1]. Efficacies of incandescent light bulbs are approximately 15 lm/W while currently available LED light bulbs can go up to 120 lm/W. [1]
2.2 LED Driver Efficiency
The efficiency of the LED driver is a great concern for power consumption since there are usually multiple lights used in a modern North American home. As LEDs run on DC power, the AC power that is used in the home must be converted to DC using an AC/DC converter. The act of converting this electrical power generates heat which introduces power loss. A simple way of calculating the loss is to measure the current and voltage, before and after, the converter. With these numbers, the input and output powers can be calculated. Furthermore, efficiency can be calculated from the input and output powers. Formulas are shown below:
Power = Voltage x Current
Power loss = Input power – Output power
Converter Efficiency (%) = (output power / input power) x 100%
Based on Canadian AC/DC Power supply efficiency standards, efficiency ratings for supplies less than 50W should not be less than: ?st≤0.09ln(?)+0.5
Where ?stt is the Canadian AC/DC Power supply efficiency standards and P is the actual power measured in the system. For example, for an 11W converter, the minimum standard efficiency is equal to 71.6%.
2.3 Flicker Monitoring
Light flicker is a common occurrence in lighting due to oscillating power input. The output of the light is directly correlated to the input. Since AC power is sinusoidal, at 60 Hz, the input power will reach zero 120 times a second. This flicker is unperceived, but in some cases such as with fluorescent fixtures with older style ballasts, perceivable flicker can occur [4]. There are a range of health effects depending on the level of flickering, from headaches to unperceived neurological effects [5]. When it comes to LEDs, their AC/DC drivers input DC into the LED, but this is a rectified AC signal, and depending on the quality of the converter, flicker can still occur (Figure 1).
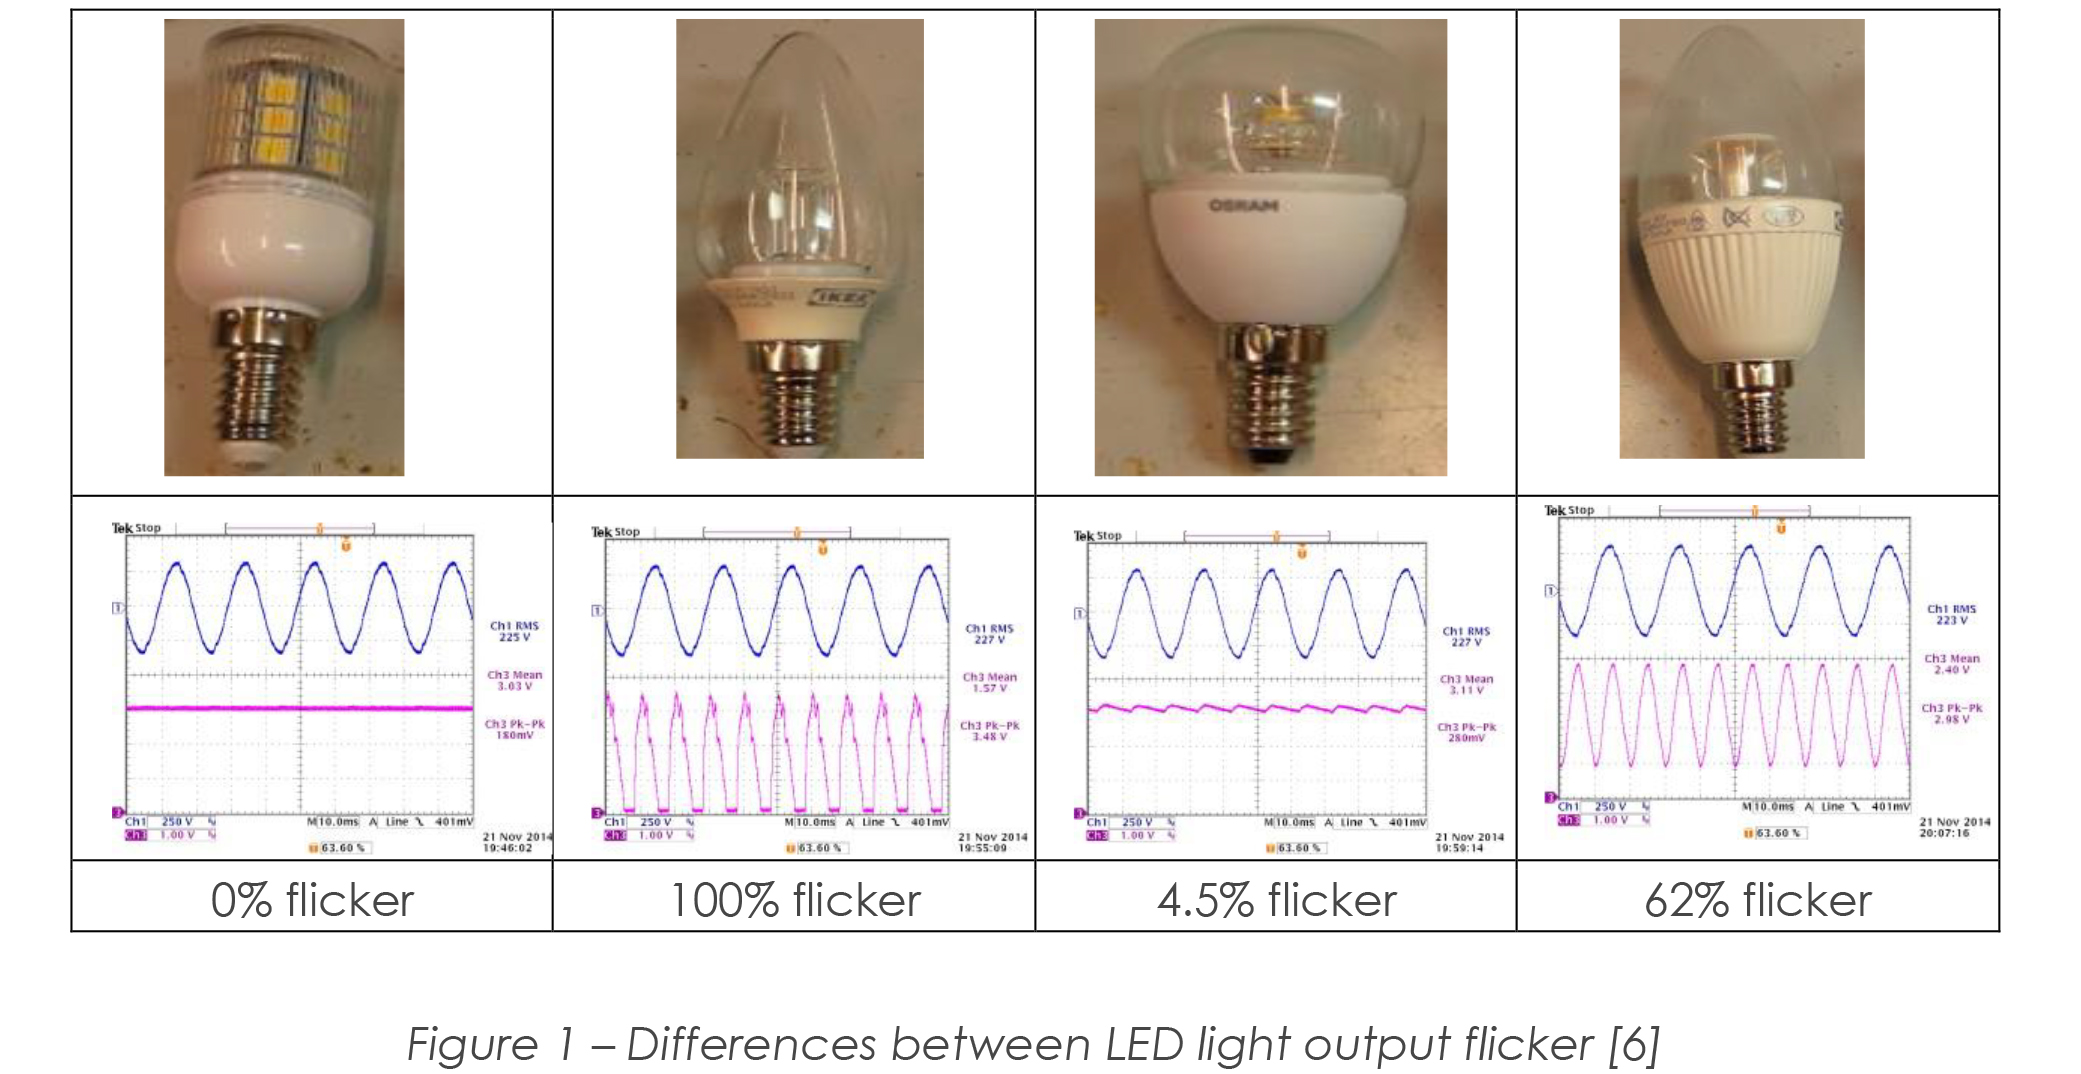
Note that the above figure waveforms from [6] indicates the 60Hz AC line voltage (in blue) and the lux sensor analog output (in red) as captured by an oscilloscope. This was not the method used in this experiment and is shown as a form of demonstrating flicker present in various light bulb designs.
There are various industrial standards defined such as IEEE 1789, California Title 20, IEC 61547and Japan DENAN that take into account the PWM frequency of the LED driver used to power the luminaire [7]. The basic calculation for % flicker that is used in this project [8]:
% flicker = (Max – Min) / (Max + Min) * 100
Flicker frequency is a parameter governed by the PWM frequency of the driver and was not measured within this project scope.
3 Project Execution
A server rack is used with a vertical board with two rows of LED lights. The vertical rows of LED lights are physically configured as follows (refer Appendix A figures 1-4):
|
iLLUMA-Drive 48V DC CENSE side |
Traditional 60Hz 120V AC side |
|
DC LED 1(high efficacy) |
AC LED 1 (high efficacy) |
|
DC LED 2 (high efficacy) |
AC LED 2 (high efficacy) |
|
DC LED 3 (13W) |
AC LED 3 (13W) |
|
DC LED 4 (13W) |
AC LED 4 (13W) |
|
DC LED 5 (13W) |
AC incandescent bulb (60W) |
|
DC LED 6 (13W) |
AC fluorescent bulb (13W) |
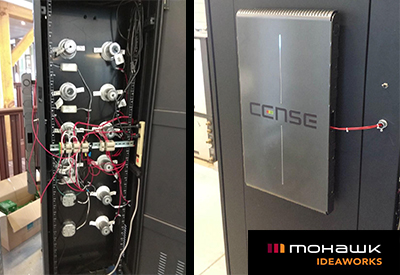
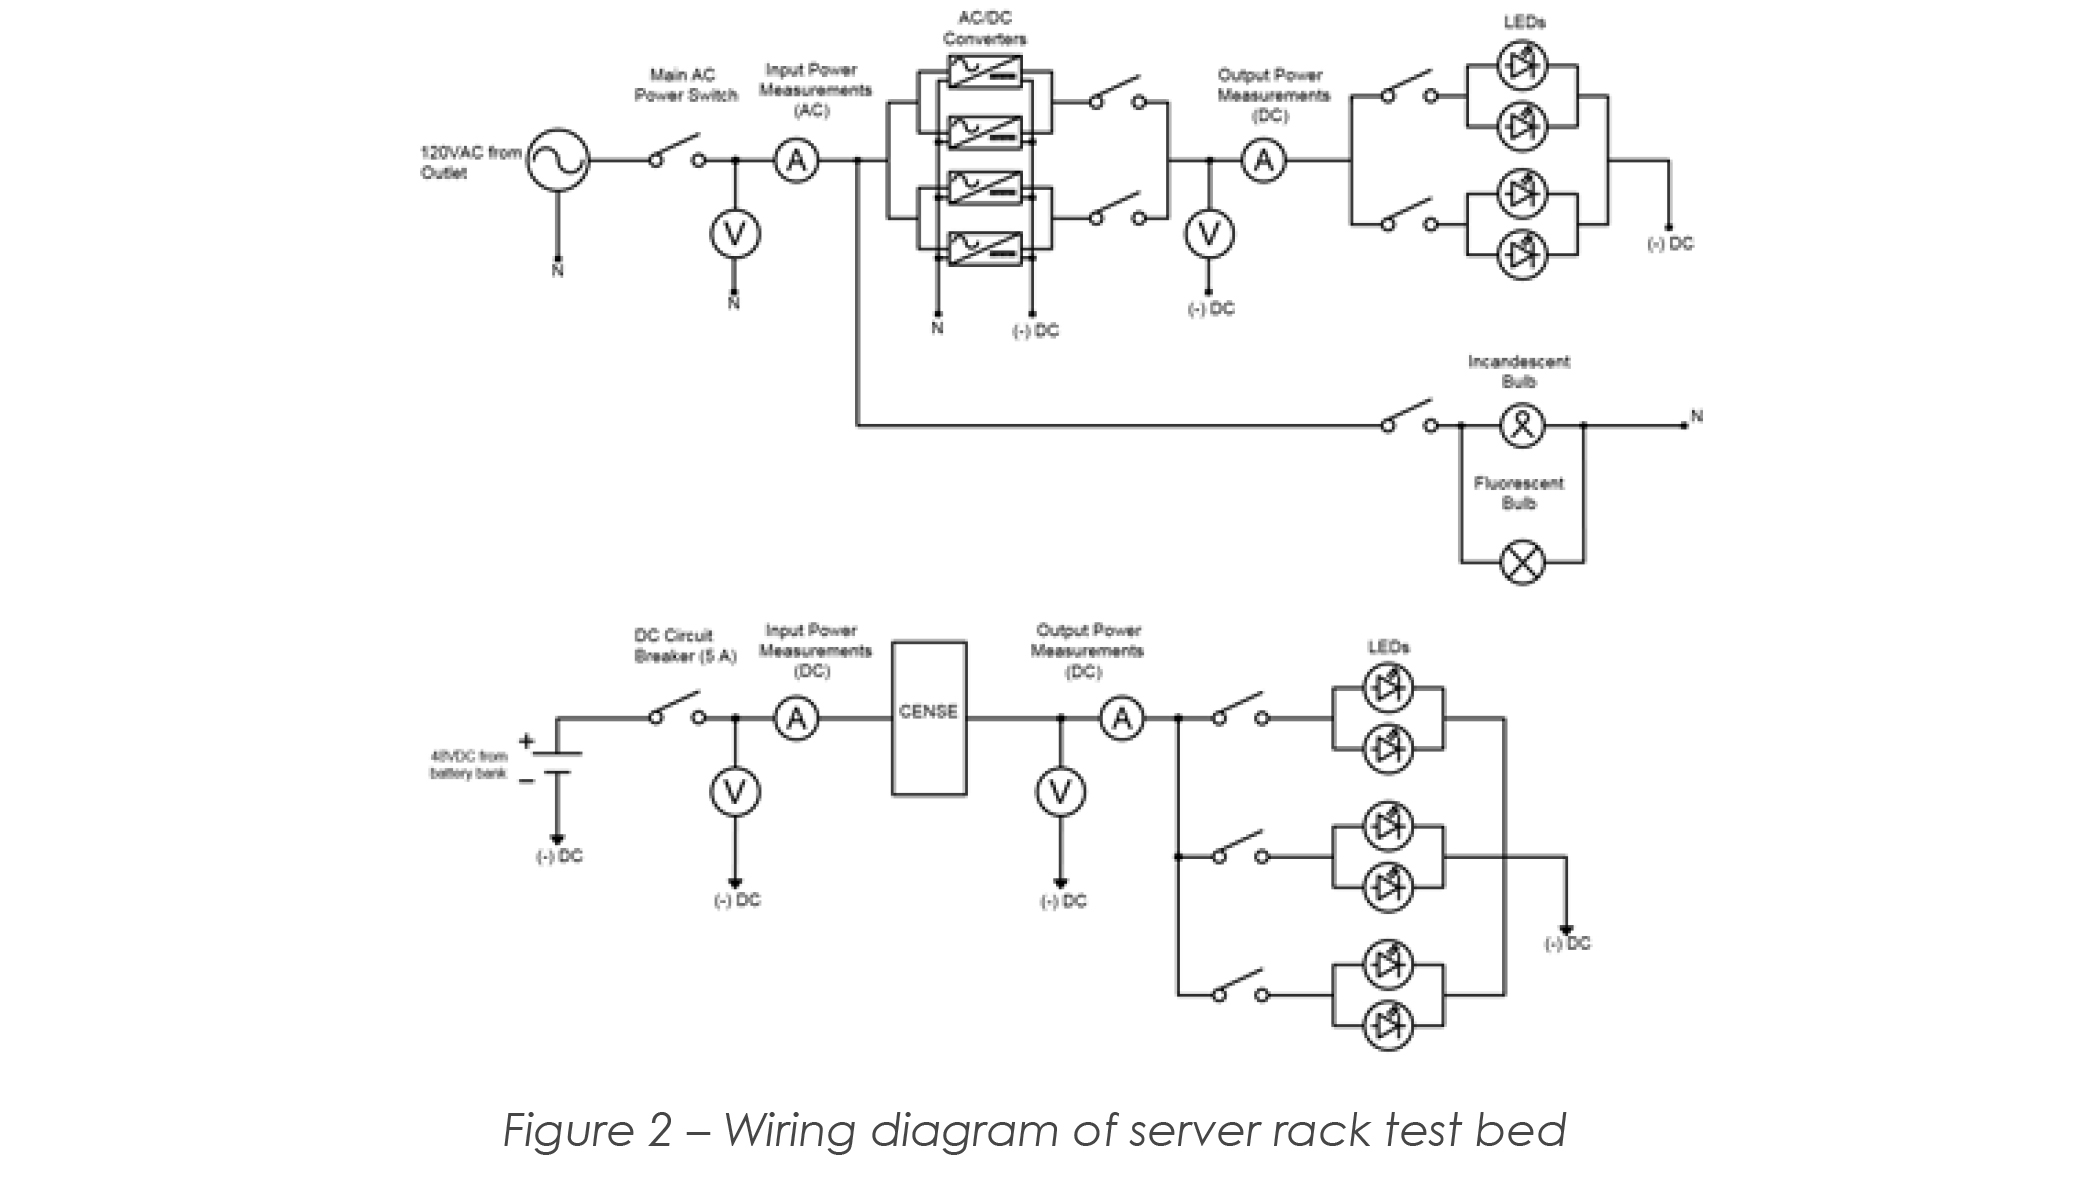
The CENSE unit is configured with one (iLLUMA-Drive proprietary) LM1 module which allows for four 100W channels with programmable DC voltages and currents. The server rack is also configured with terminals to connect conventional multimeters for measuring voltages and currents of the respective LED power circuits. The schematic below shows the wiring diagram for this section of the test bed.
The flicker monitor system is attached onto the server rack door, which when closed, measures the lux and flicker of each side without any interference. The data produced by the flicker monitor circuit is then displayed to an attached computer monitor. A wireless keyboard and mouse are used to run the microcontroller program in the flicker monitor system. Appendix A, figures 1-6 of the report shows detailed photos of the project test rack.
3.1 Traditional AC/DC LED Driver Efficiency Test
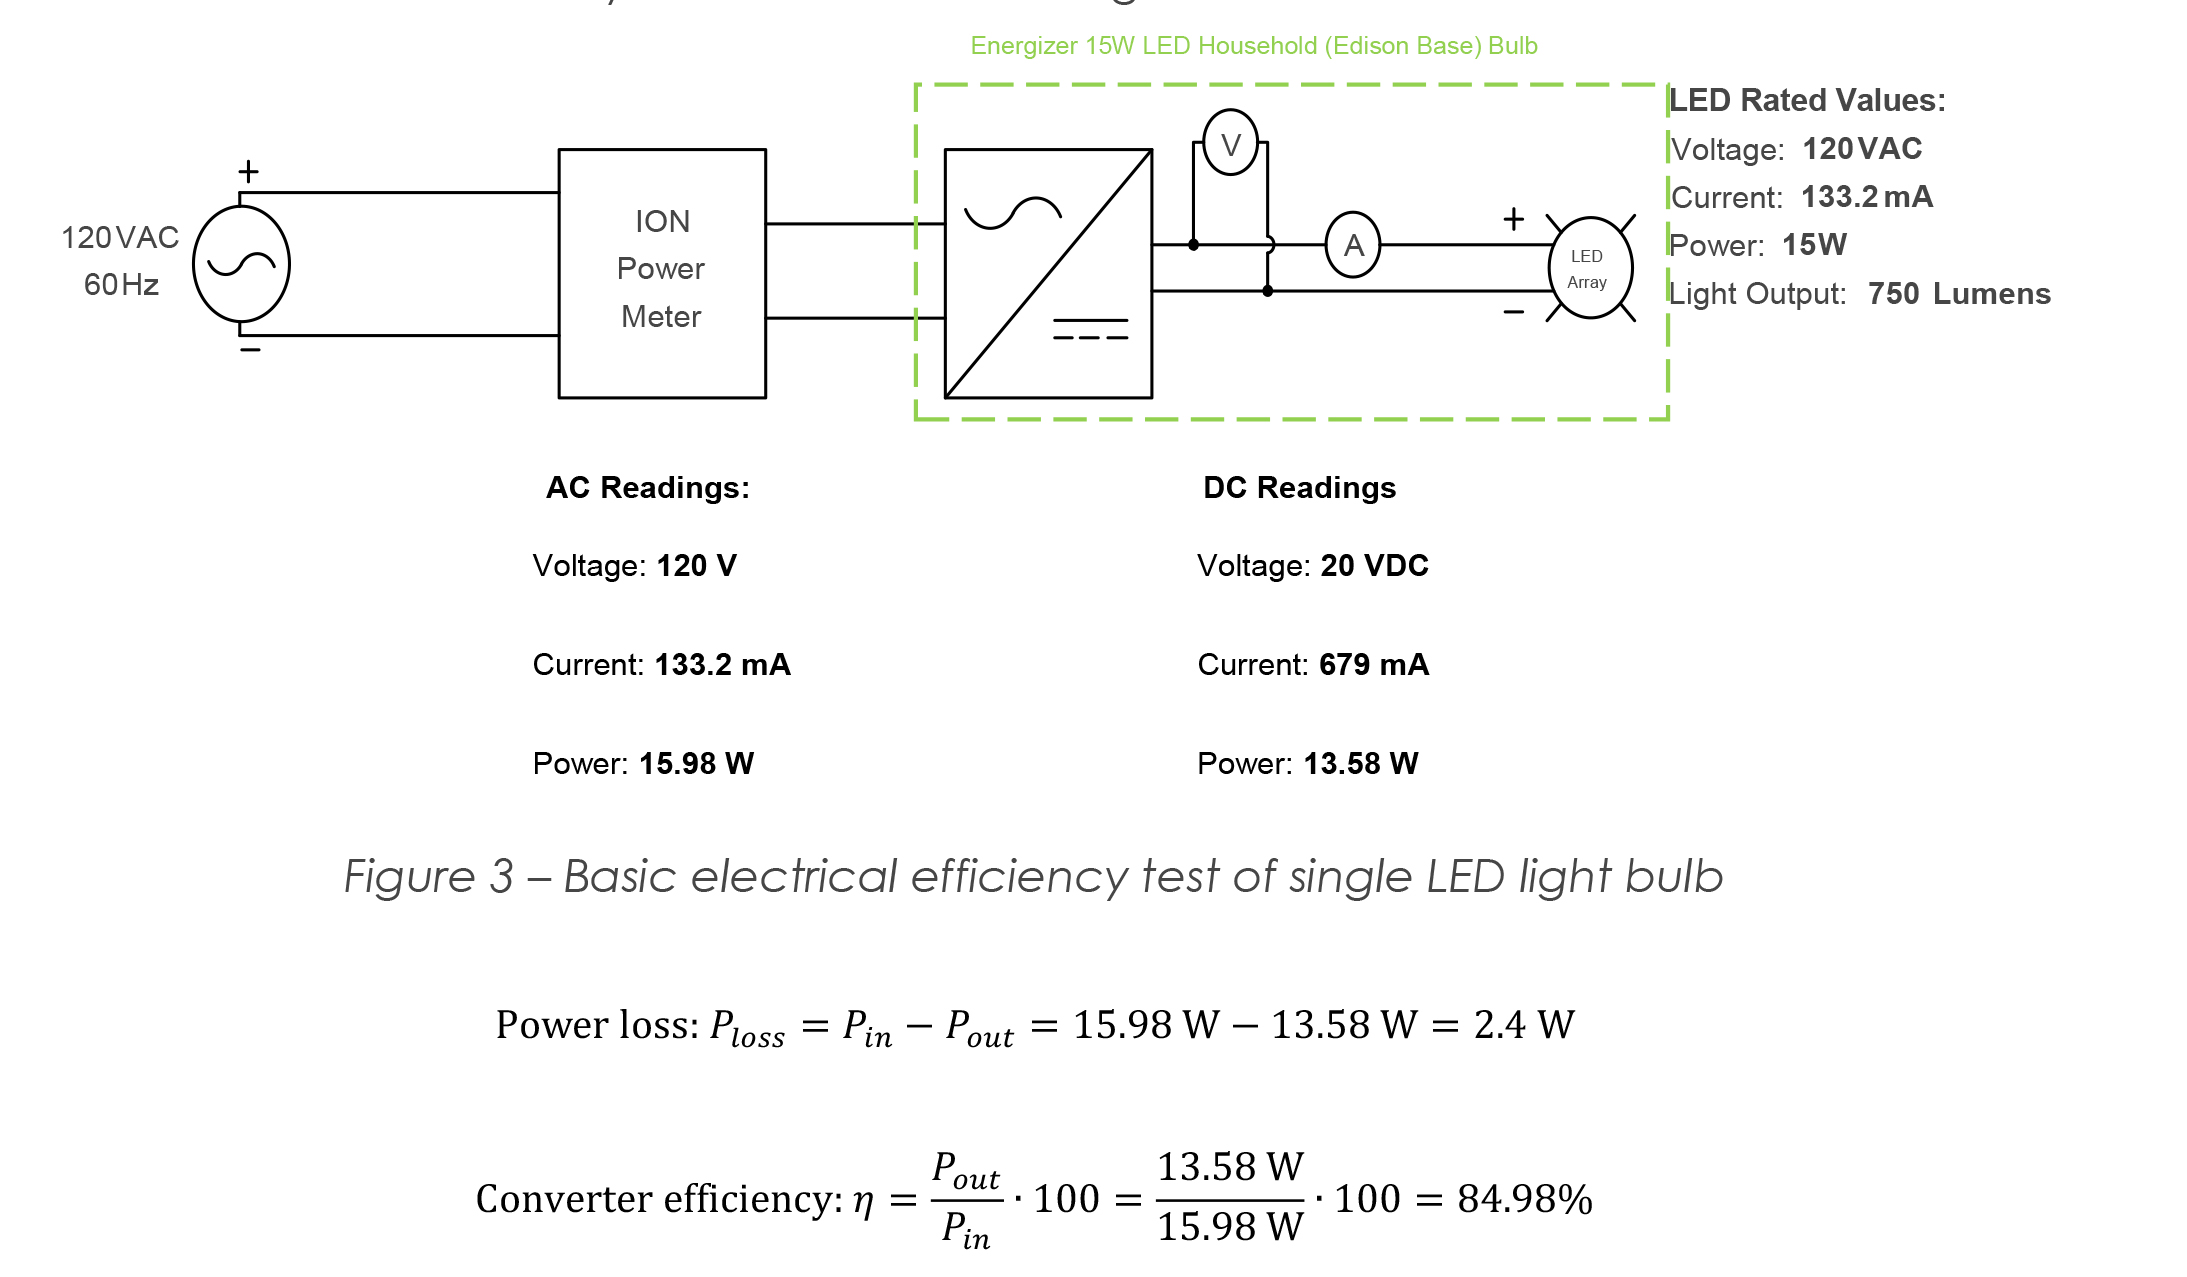
Prior to the server rack testing, a regular AC LED Edison-base bulb that is commonly found in households was taken apart and the efficiency was determined (Figure 3). The green border indicates the physical enclosure, which includes the LED array, the converter, heat sink, and the screw-in Edison-base that goes into the light fixture. To measure the efficiency, a Schneider ION 7650 power meter was connected at the AC input of the light fixture. The bulb was plugged into the fixture with the exposed DC wiring, and a DC clamp amp meter and volt meter were used to measure the listed parameters below. The calculated efficiency is also shown below figure 3.
3.2 Flicker Monitor Design
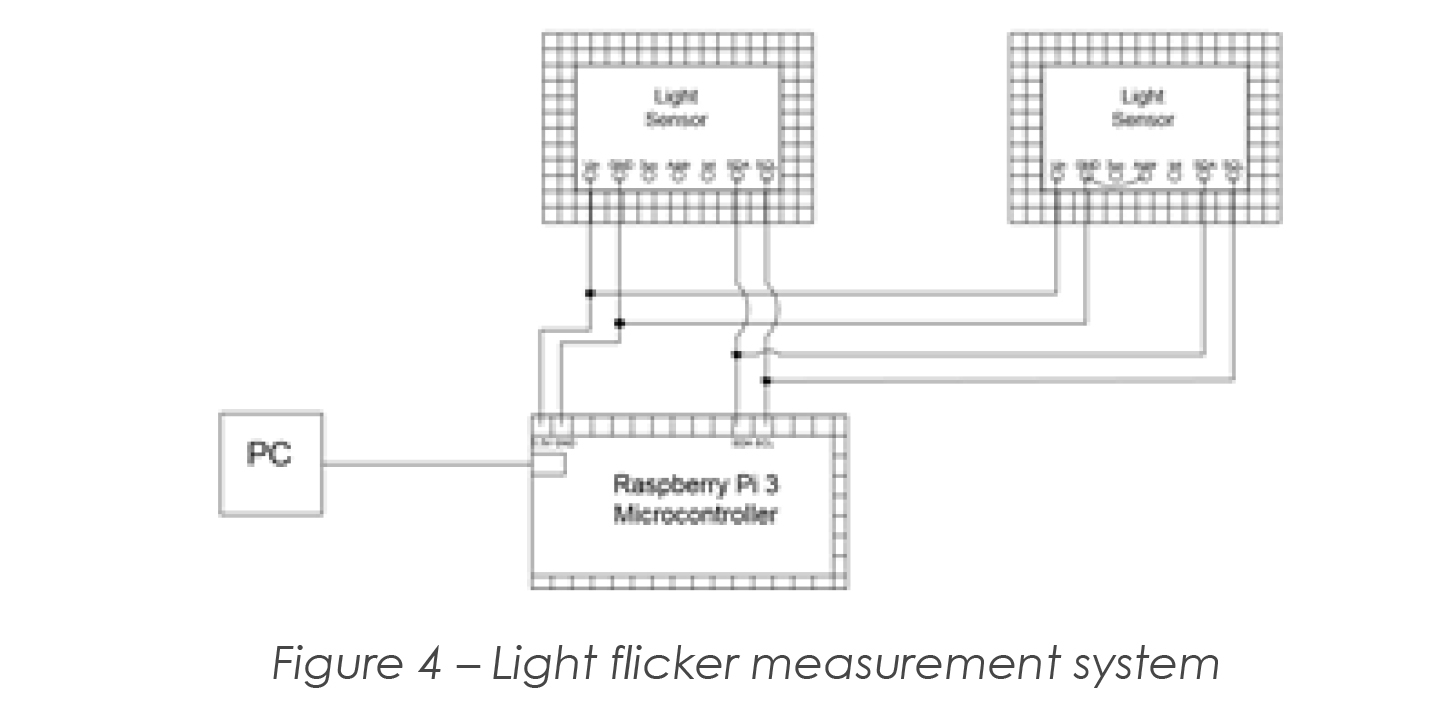
The flicker monitor consists of two TSL2561 lux sensors from Adafruit connected via I2C bus to a Raspberry Pi 3 microcontroller. The microcontroller is programmed using Python 3 code that collects the instantaneous values from the lux sensors and displays them in a terminal window of the computer monitor screen (refer Appendix A figure 6 for program output screenshots). The data is recorded as a comma separated value (csv) file for further graphical analysis. Figure 4 below shows a simple schematic of this flicker monitoring system. Appendix A, figures 5 and 6 show the physical installation of the system inside the door of the server rack test bed.
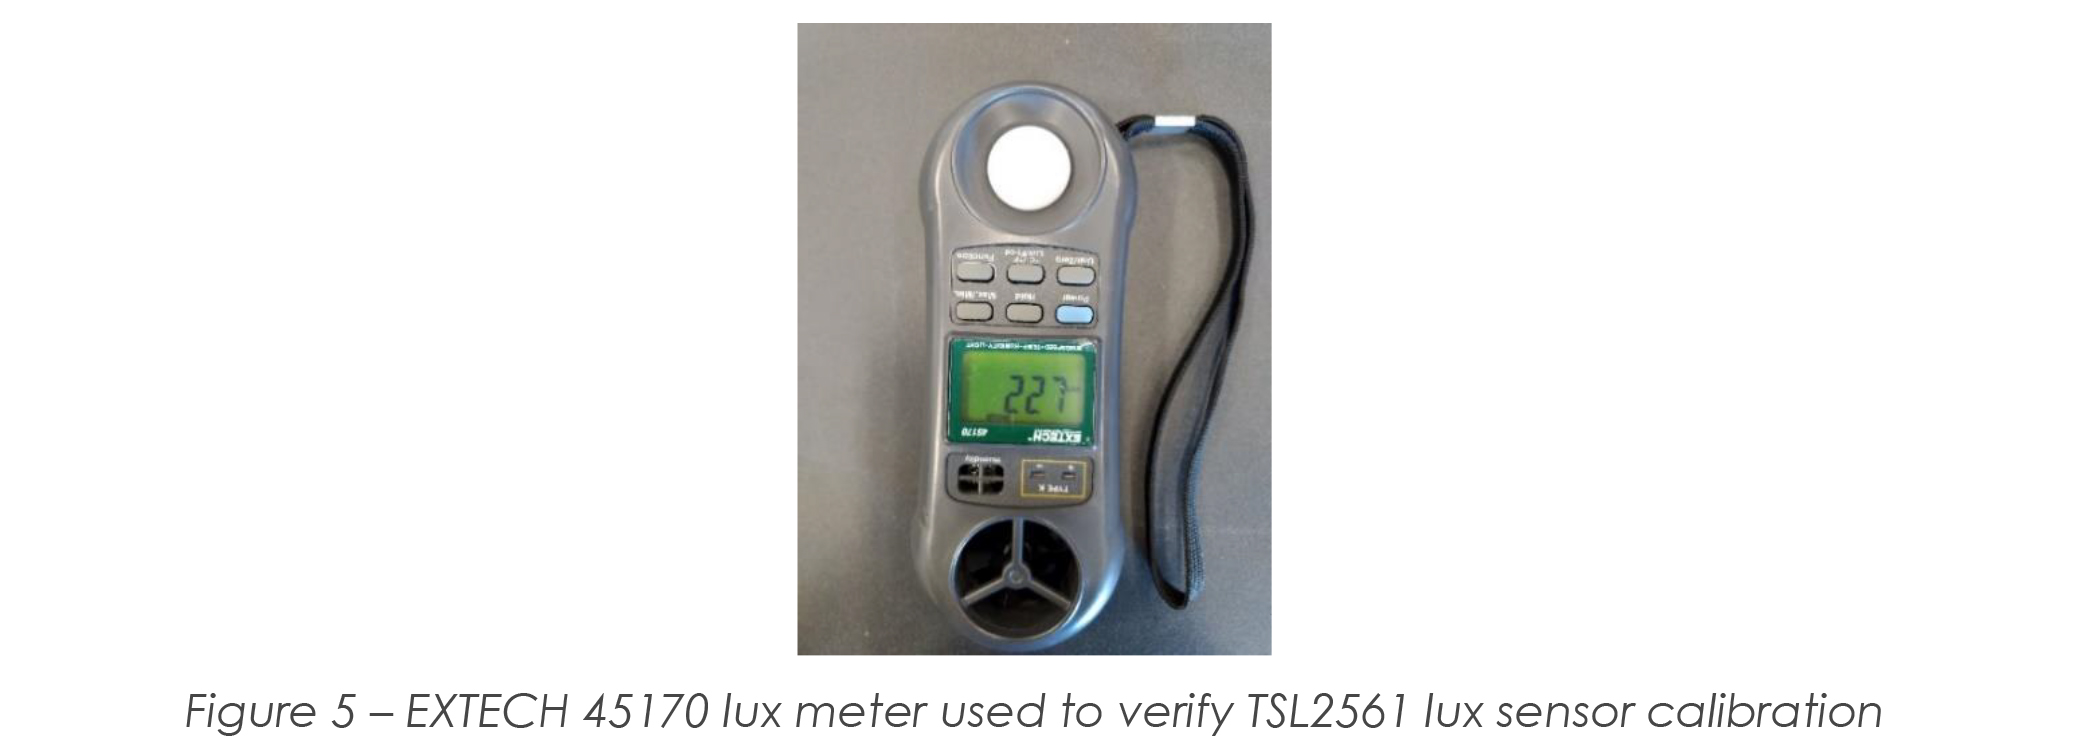
The TSL2561 lux sensors came factory calibrated using the standard value of 1 lux unit being equal to 1 lumen / square meter. A commercial lux meter1 was used to further verify the calibration of the TSL2561 lux sensors in the lab and also used for comparison purposes to verify the results produced by the Raspberry Pi 3 microcontroller. Figure 5 shows the EXTECH 45170 lux meter used as reference.
Due to the operating charactersitics of most power converters used in LED drivers, the sampling rate of the Raspberry Pi lux sensors needs to be set order to minimize errors in the data. For this experiment, a sampling rate of 1ms was used.
Note that although typical test standards refer to a data sample size of 2 seconds with minimal interval between samples to be 50μs, the data range used in this project was 500 samples at 2.08ms per sample and a sample interval of 1ms. All results shown in the report use this base.
4 Results:
4.1 Power efficiency
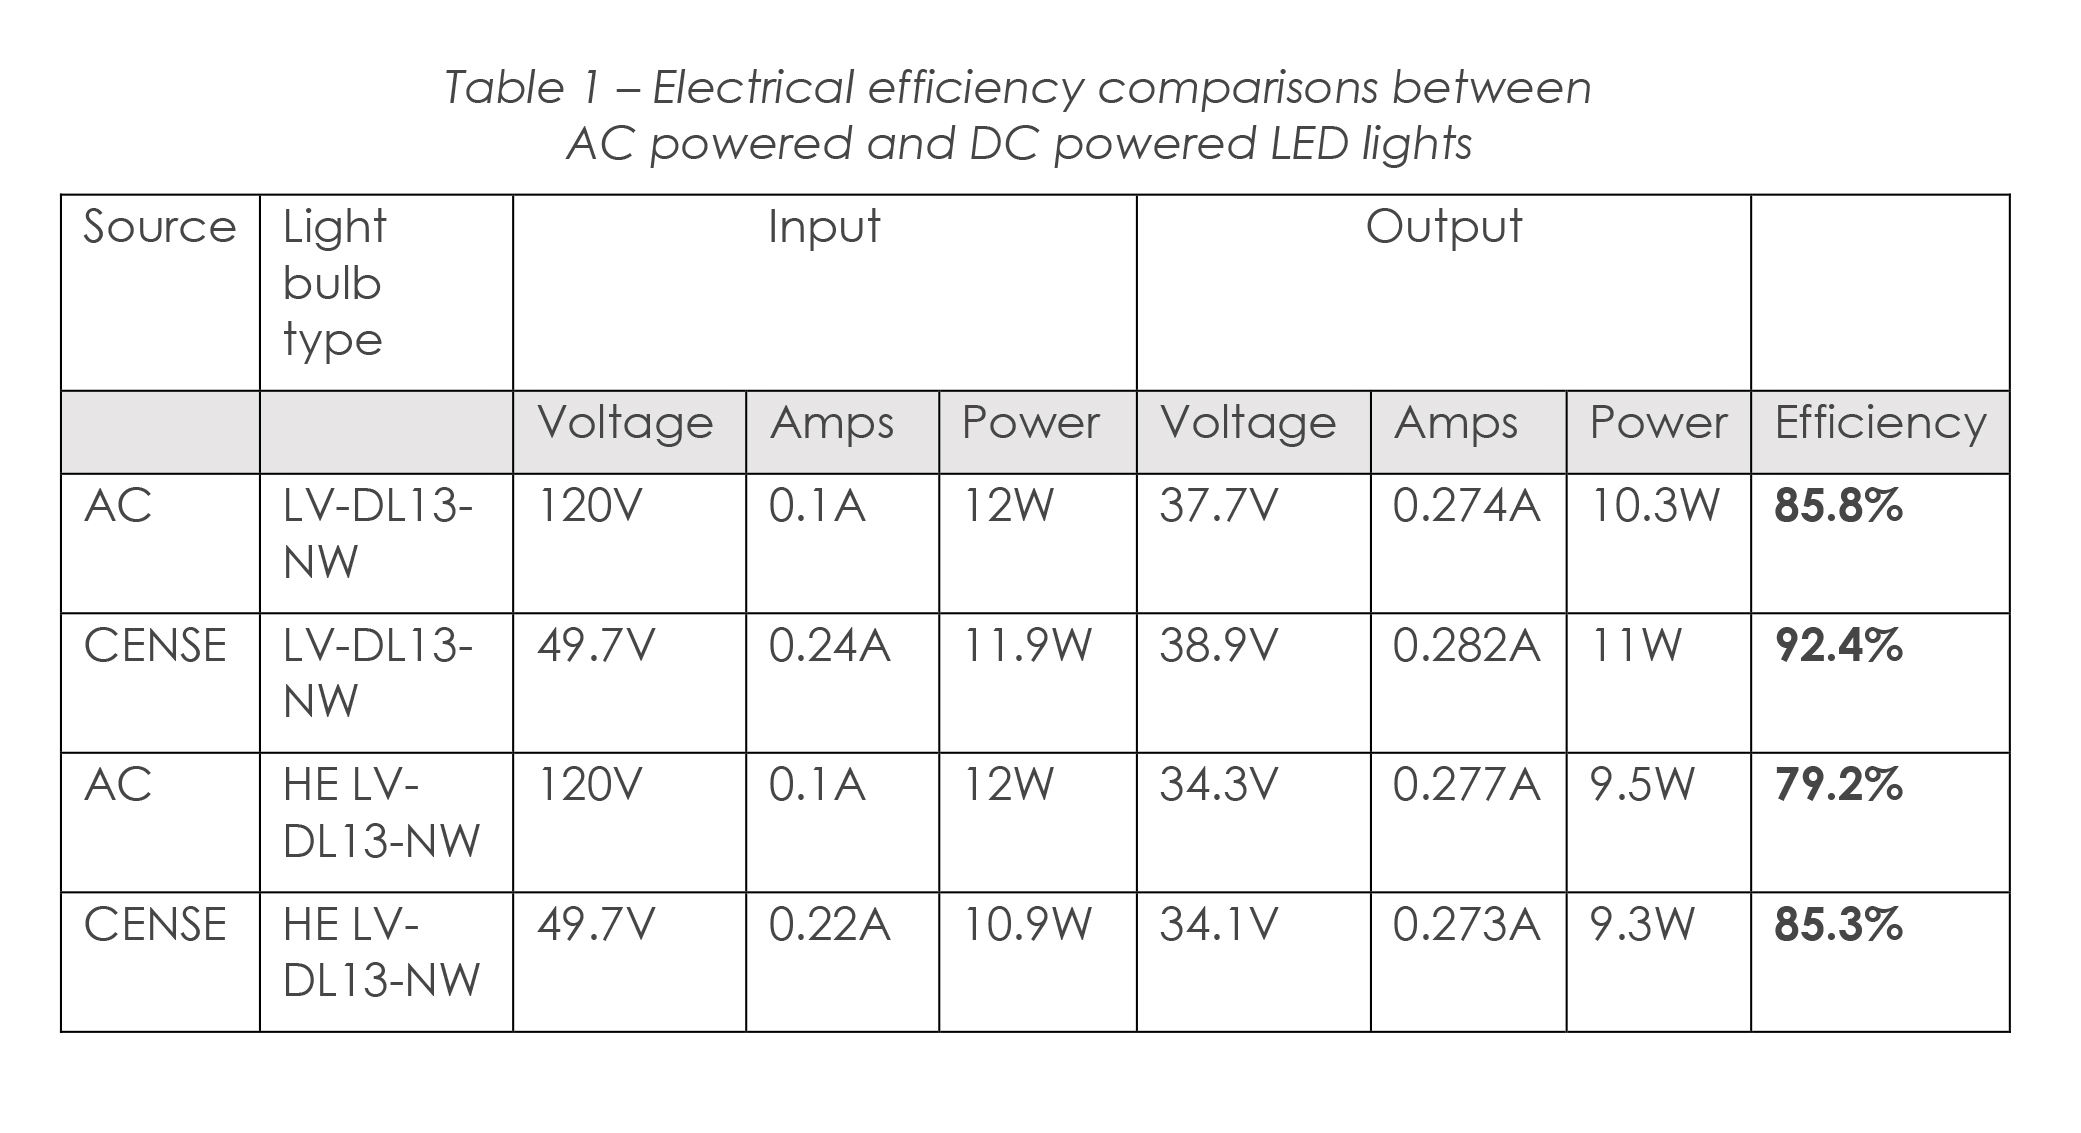
The LED power converter efficiency comparisons between the AC powered LED lights versus the DC CENSE powered LED lights is shown below in table 1.
4.2 Light efficacy
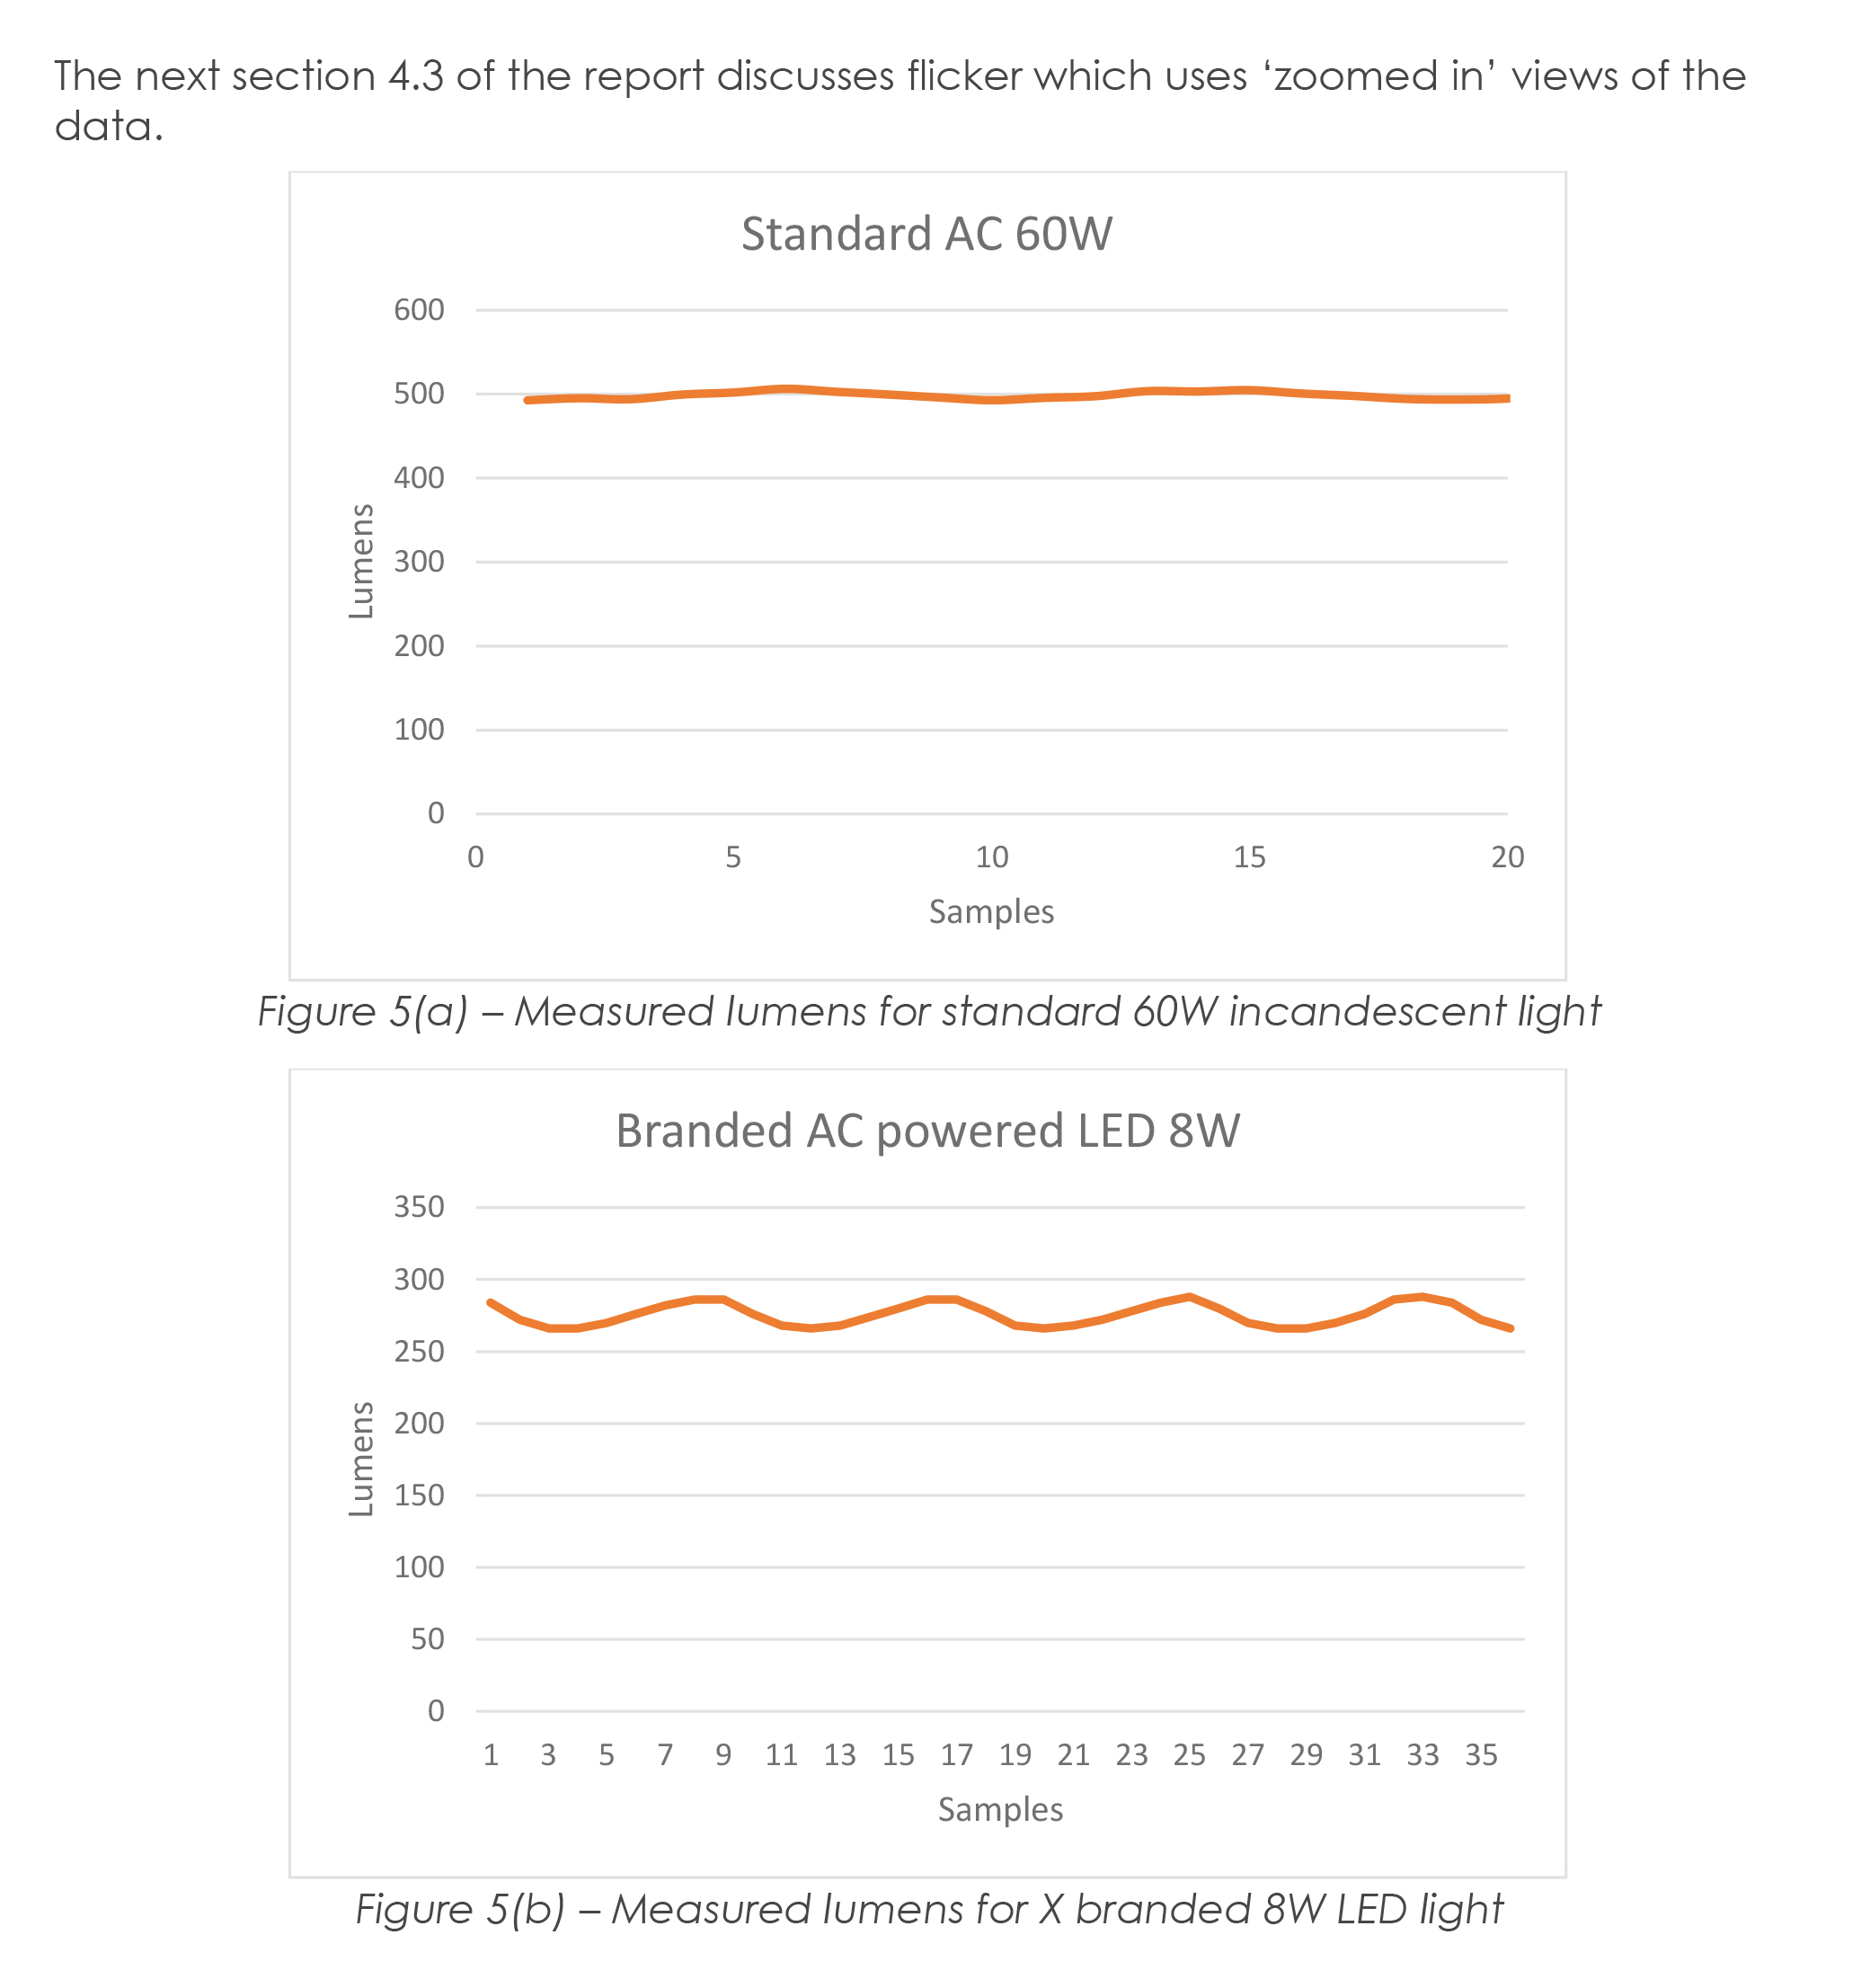
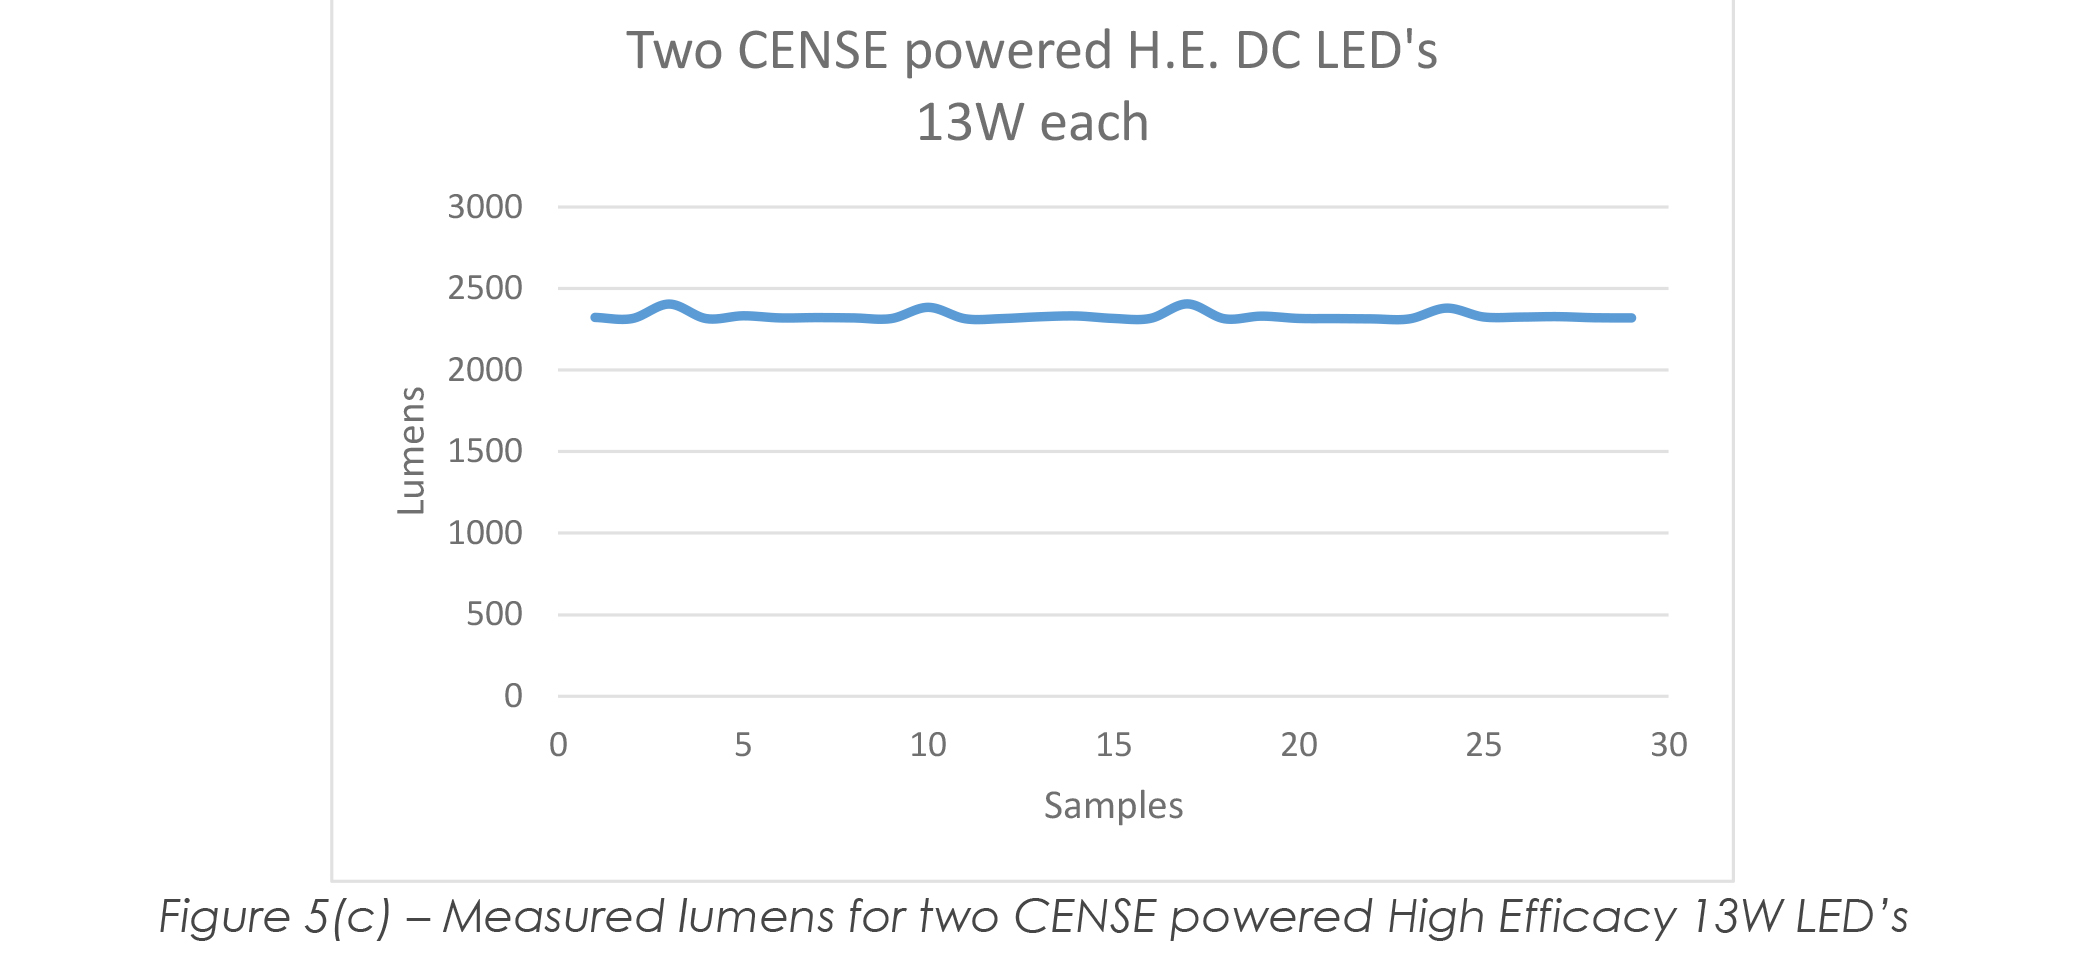
Figure 5(a), (b) and (c) below shows sample graphs produced by the Raspberry Pi flicker monitor sensor data. The y-axis indicates the lux in lumens and the x-axis shows samples recorded at 2.08 ms per sample. Note that thes graphs are used to simply indicate the output of the Pi lux sensors and verify the lumens output of each light bulb.
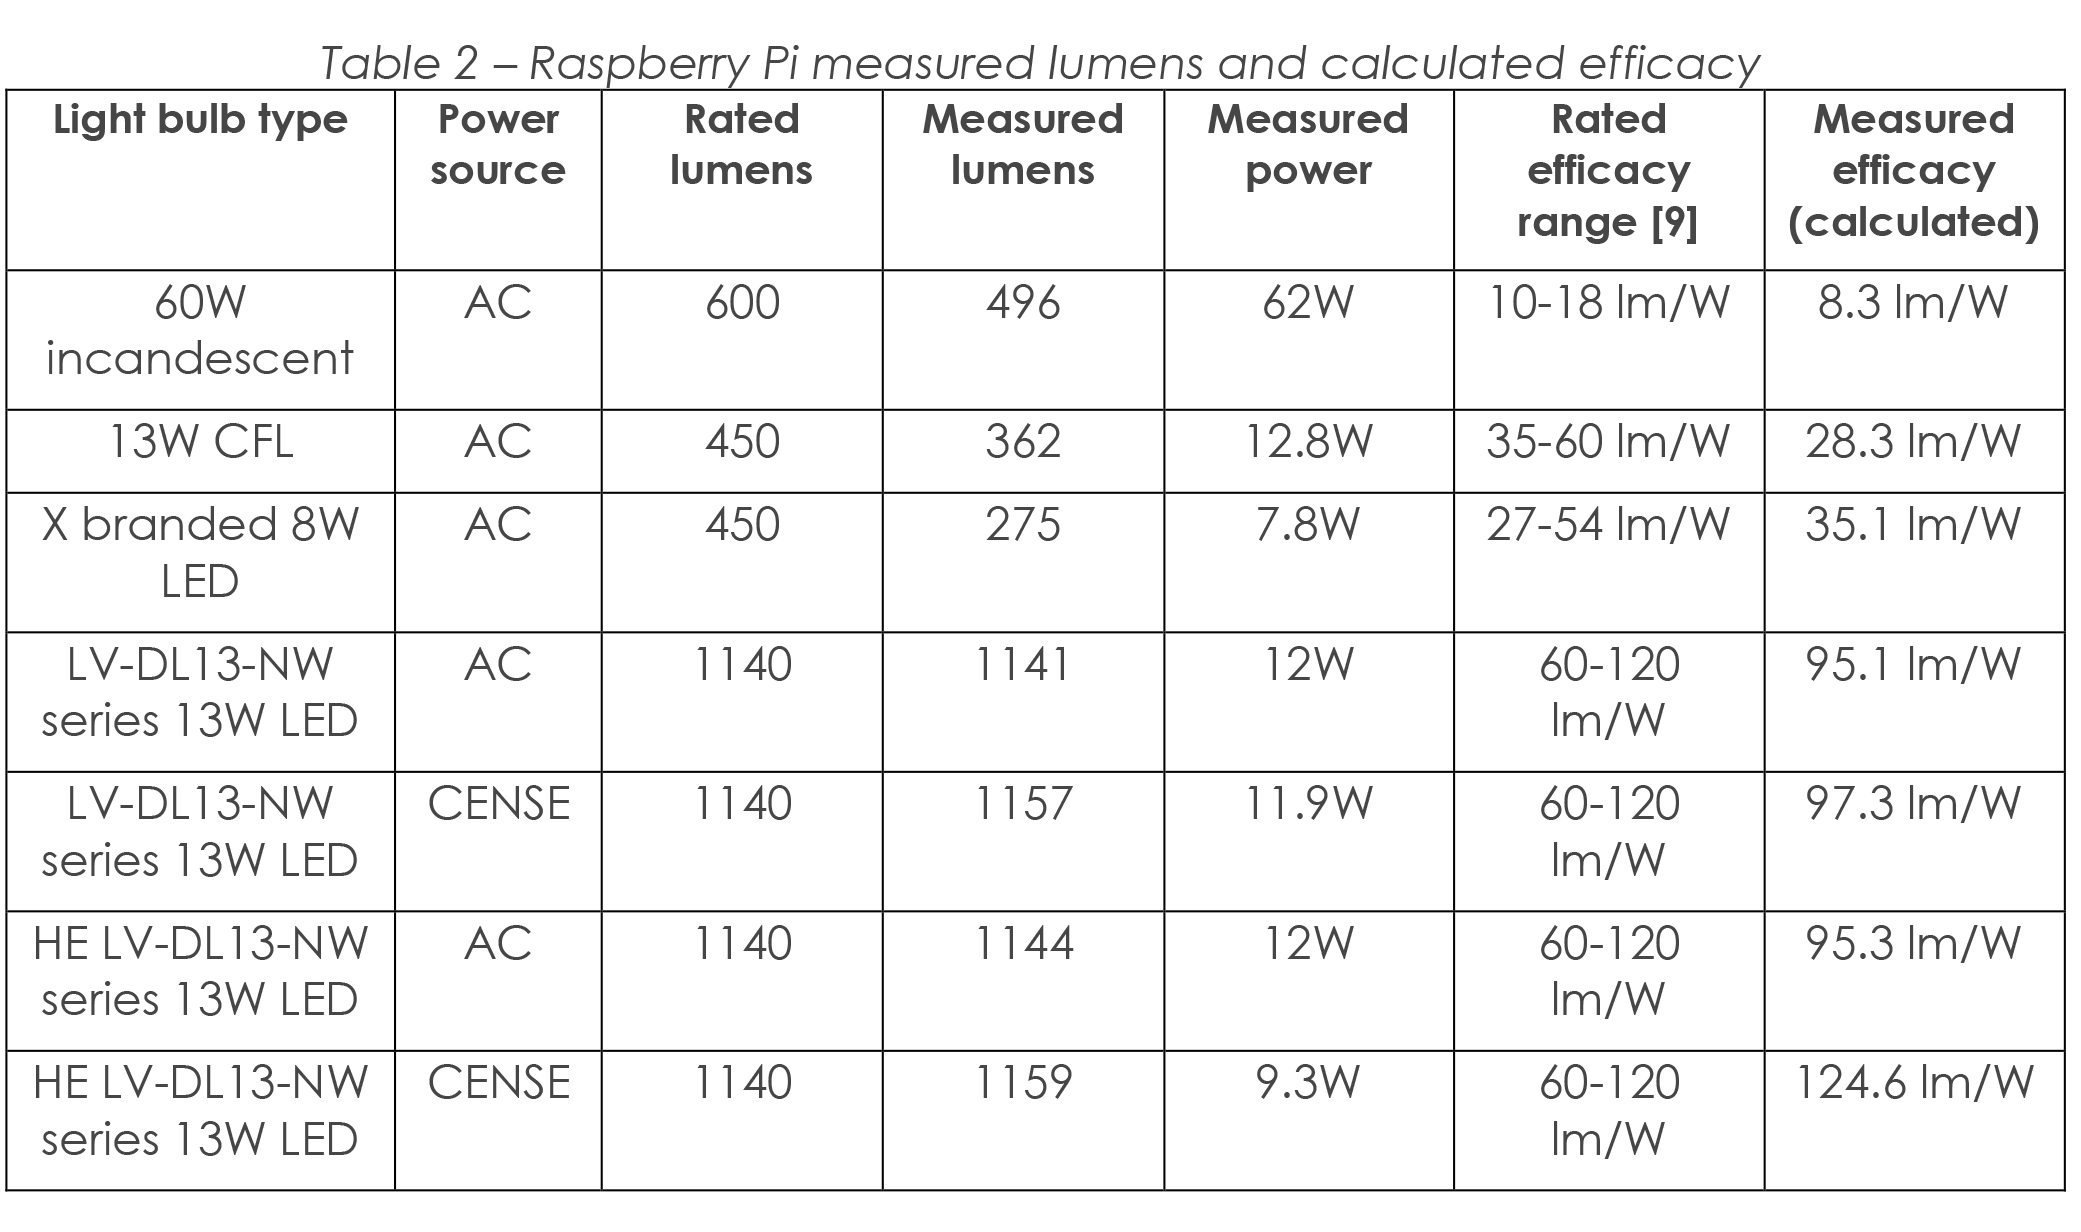
The table below compares the efficacy using the rated lumens and the rated power for each bulb and the measured values for lumens and power.
4.3 Light flicker
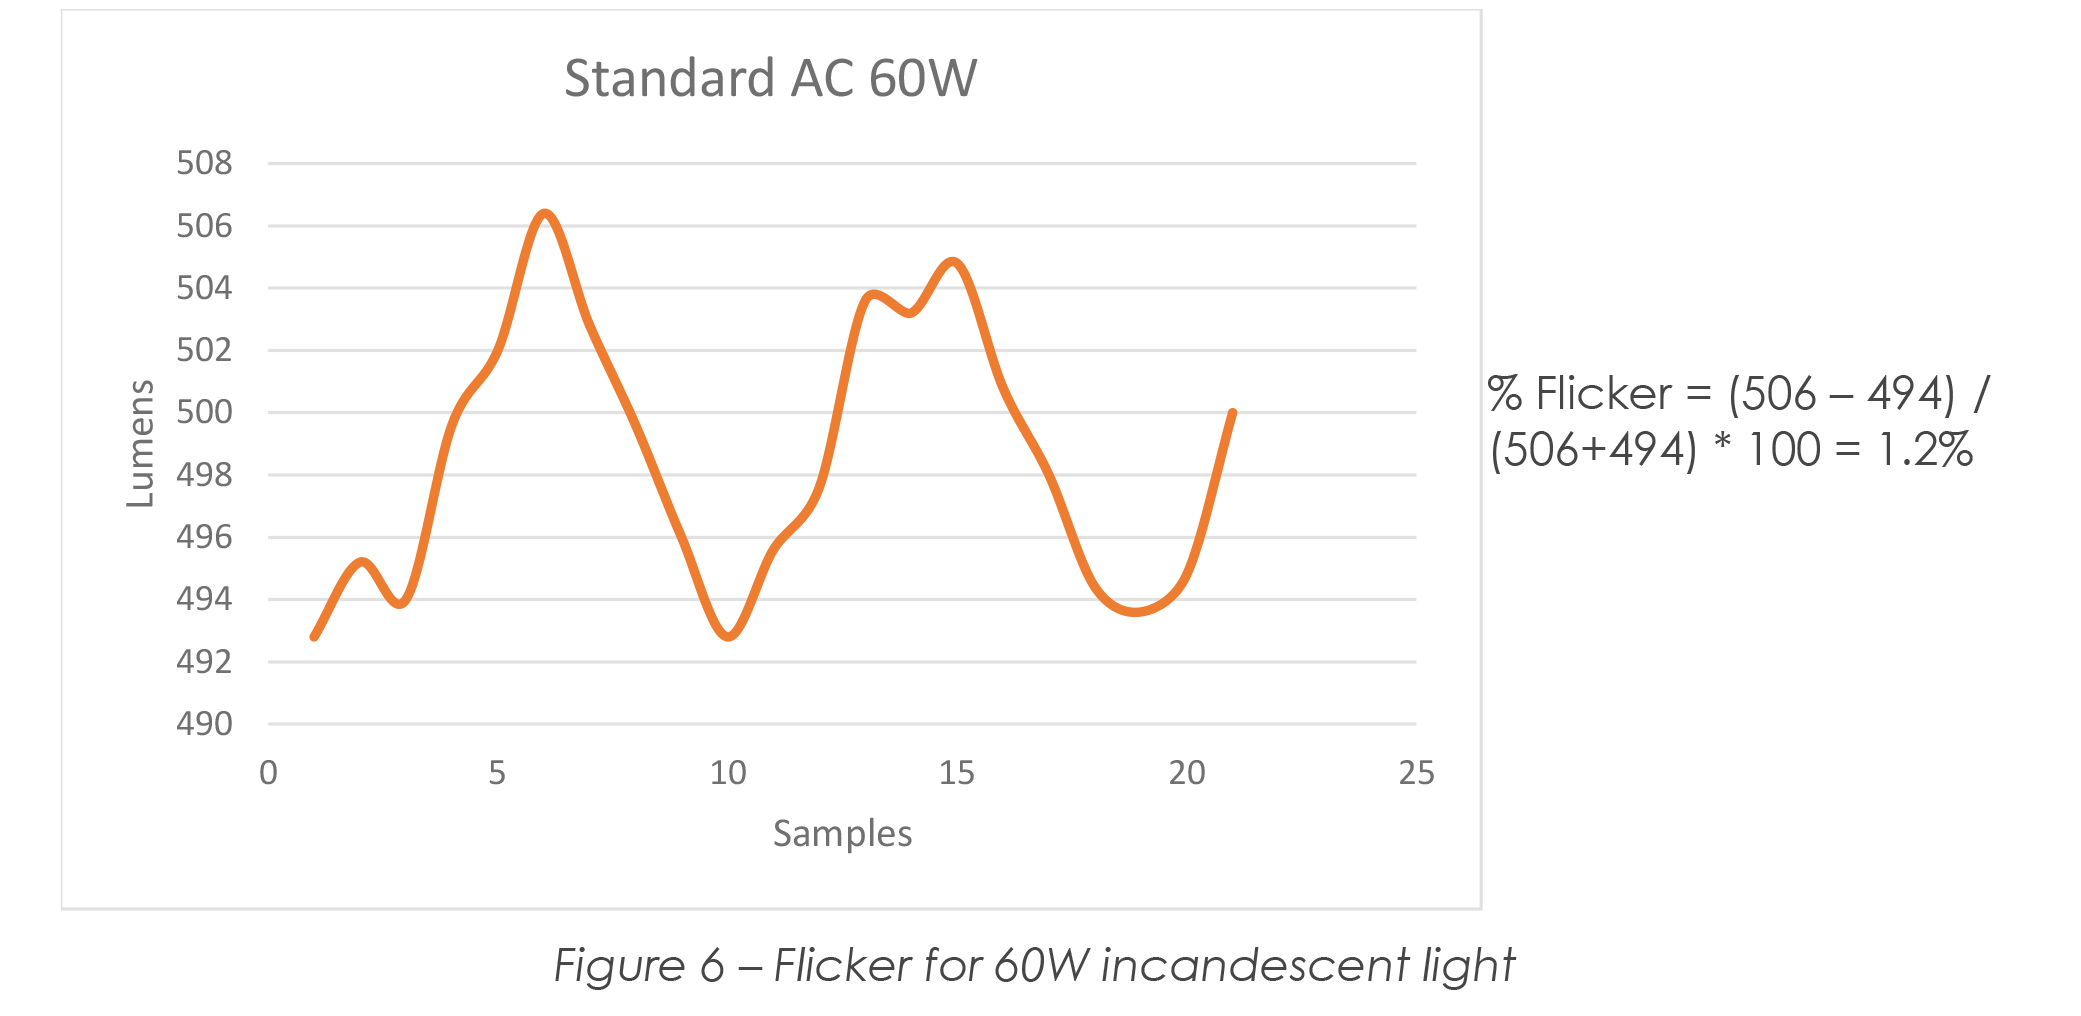
Figure 6 show a zoomed y-scale axis of the measured lumens over approximately two cycles of data (2.08ms per sample) for the standard 60W AC light bulb. This information is used to calculate percentage flicker by using the maximum and minimum peak values obtained from the specific data set.
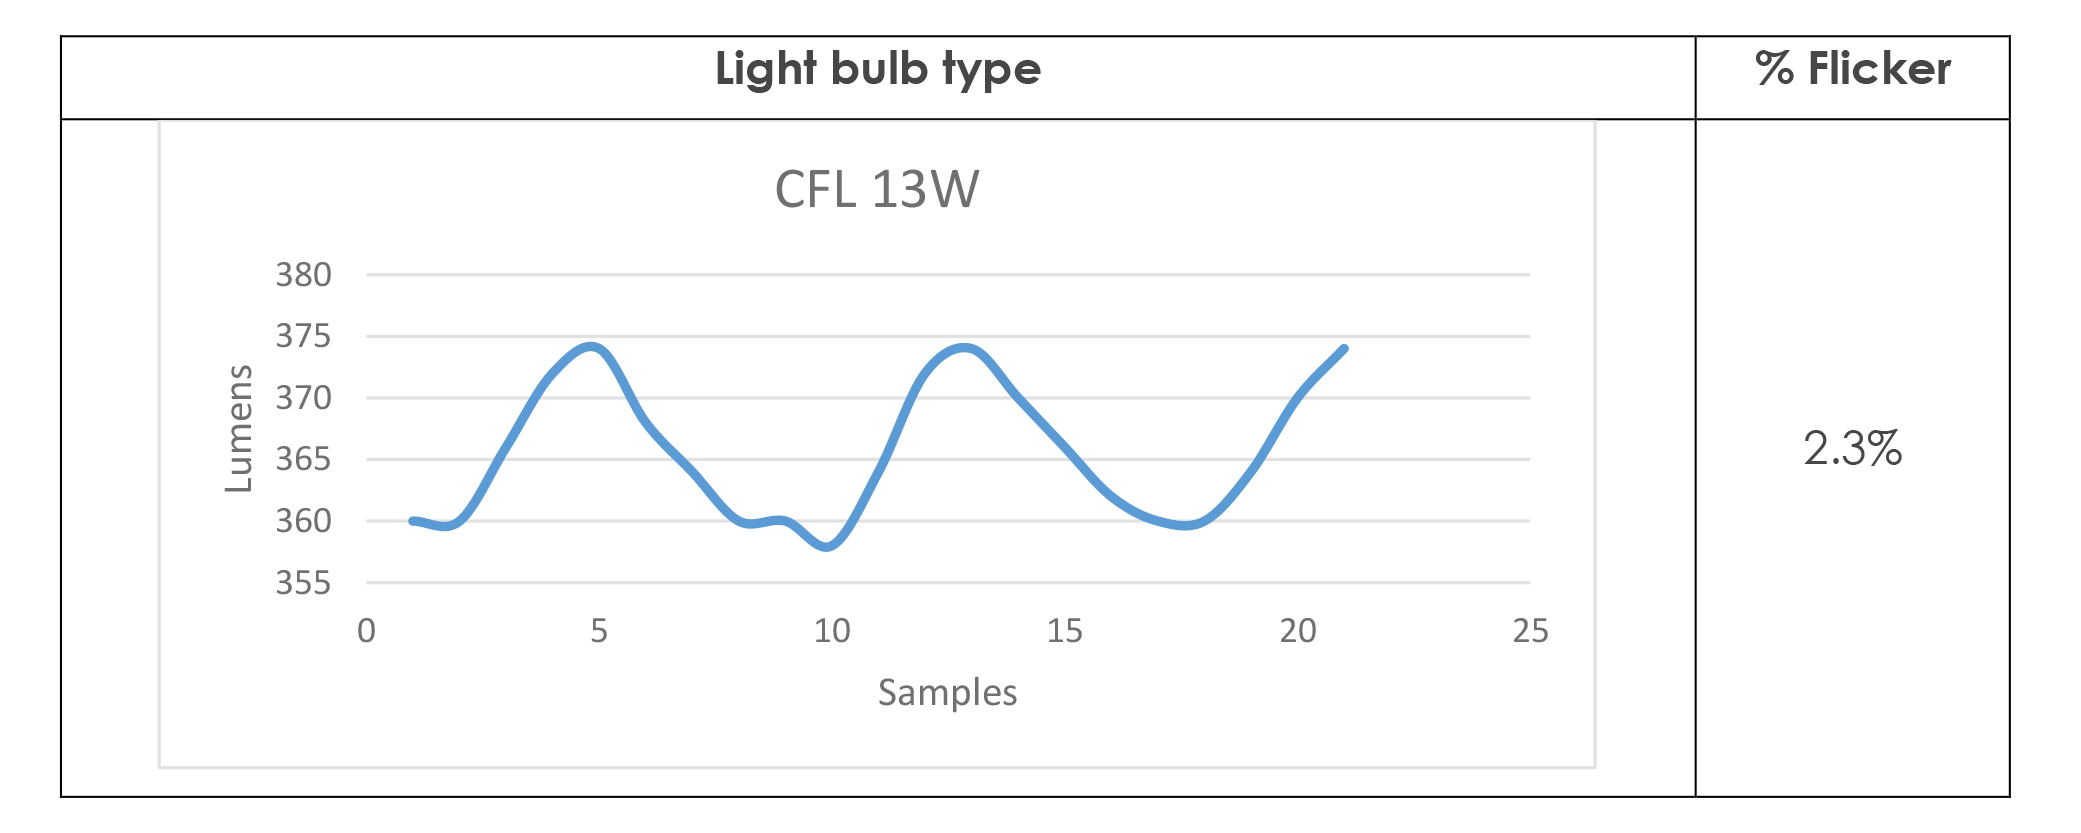
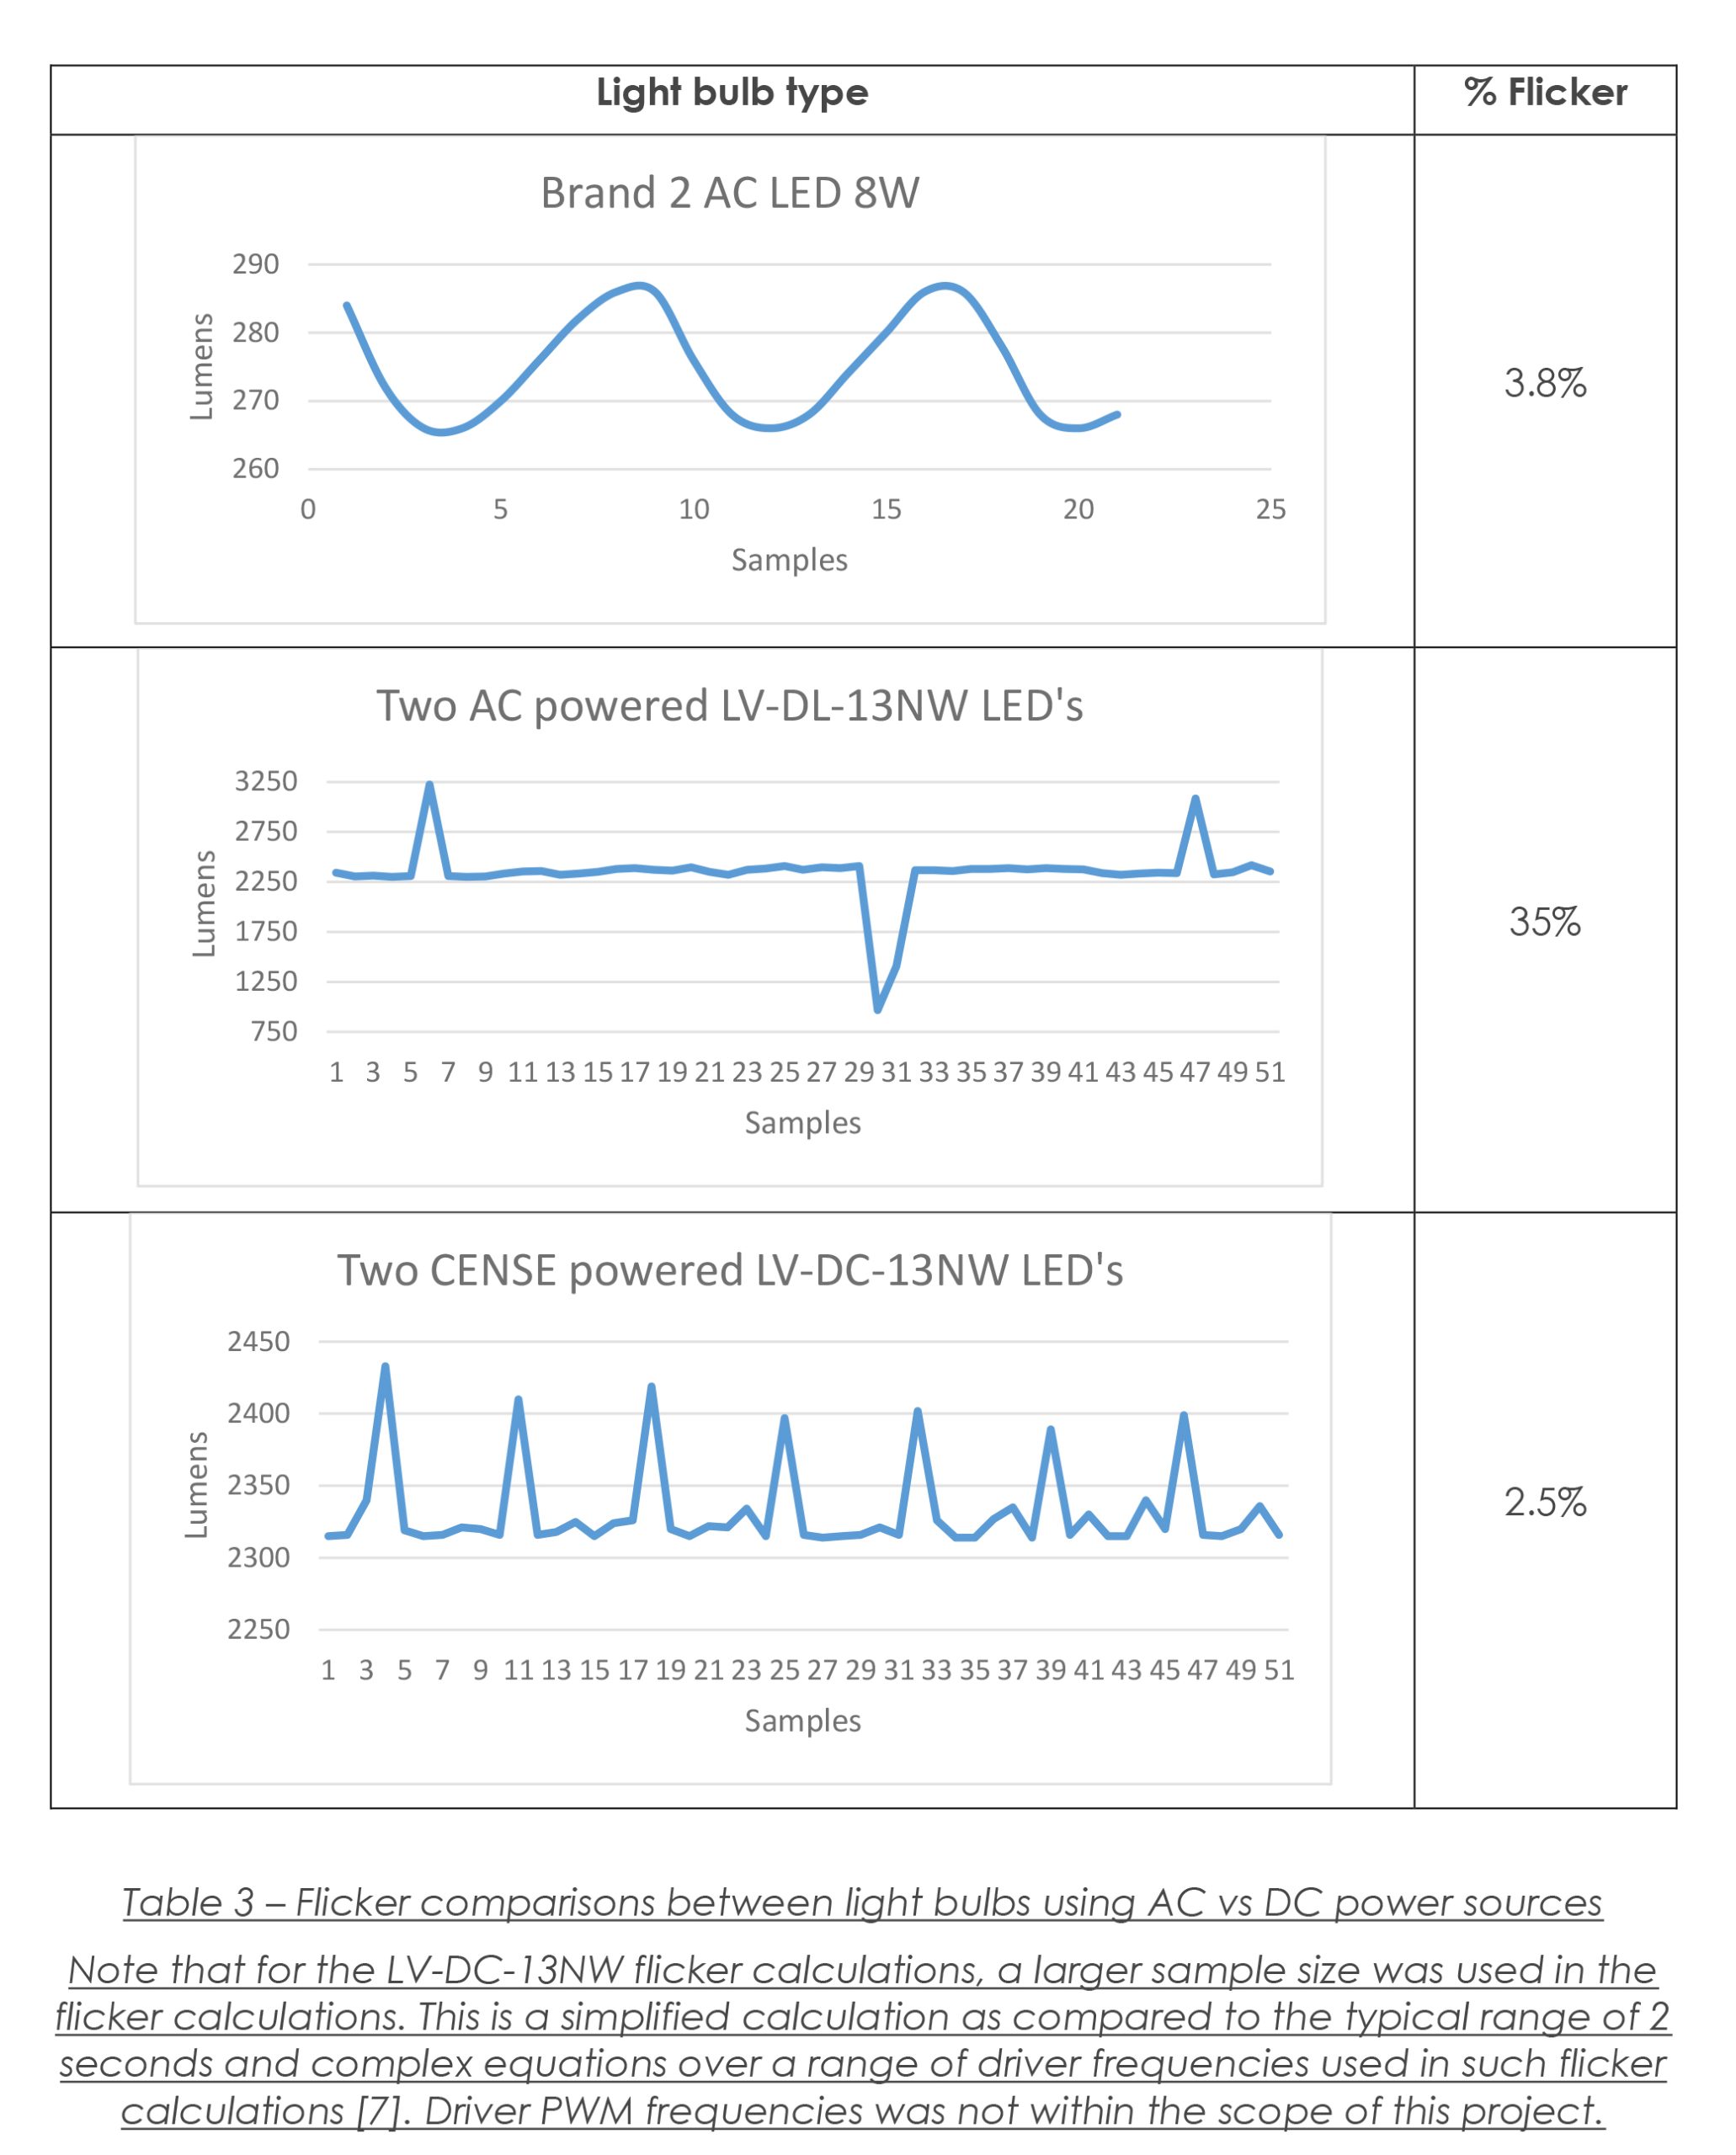
The following table shows the associated graph and calculated flicker using the same method as shown above.
4.4 Analysis of results
Table 1 clearly showed that the DC CENSE powered LV-DS-13NW LEDs has higher efficiencies than similar lights that were powered using traditional 120V 60Hz AC power sources. There was a gain of 6 – 7% efficiency when the same bulb was powered using a DC source (the CENSE unit) instead of a standard AC source. Table 1 also indicated that the high efficacy LED’s used in the experiment consumed less power than the standard efficacy LED, even though the high efficacy LED’s were slightly less efficient. This is important to note when analyzing the results for output lumens, as it is proven that the high efficacy bulbs produce a higher lumens output while consuming lower power (refer Table 2).
From section 4.2, it is evident that the newer technology LED light bulbs produced a higher lumen output while consuming less power than their older counterparts. In addition, when the same LED bulb was powered using the DC CENSE unit vs AC power, it also resulted in a higher efficacy, 95 lm/W for the AC versus 125lm/W for the DC powered.
As part of the flickering analysis, Figure 6 and Table 3 show that the natural AC light bulbs have clear predictable cycles in the light flicker output; while the higher wattage DC LED’s have an inconsistent flickering pattern, unless the sample size is increased. As expected, the natural AC bulbs have less flicker than LED’s due to the bulb technology used in producing the light output. As the LED light output is produced by power converters rectifying or regulating an input voltage signal through PWM, this causes larger flicker on the light output. The DC CENSE powered LED has significantly less flicker than the AC powered LED (2.5% versus 35%) due to the different switching technology used in the LED drivers. Again, the scope of this project was not to investigate the driver PWM switching algorithms and the relationship to flicker or efficiency.
5 Conclusion
Results from this project indicate that the DC powered LED lighting system proved to be more efficient than similar LED lights powered using traditional AC power. This is due to the elimination of the AC/DC conversion process that generates heat at every light fixture which introduces greater losses. The experimental techniques from section 4.1 indicate an average electrical efficiency of 6% per light fixture gained by using the DC CENSE unit instead of the traditional AC unit. The DC powered LED light bulbs also had increased light efficacy, ranging from 2 – 29lm/W, than when powered using standard AC sources as evidenced in section 4.2. The flicker monitor data from section 4.3 shows greater fluctuations in the light output of the AC powered LED as compared to the DC powered LED light output, with the CENSE powered lights exhibiting roughly 18 times less flicker than the AC powered LED bulb.
Further testing can now be done using this test bed with different loads to quantify results. The Raspberry Pi flicker monitor could be further developed to capture other factors of light output such as UV, Correlated Colour Temperature (CCT), Colour Rendering Index (CRI), etc. As the iLLUMA-Drive CENSE unit is capable of powering various DC loads besides LED lighting, the results of this project pave the way to further applications for the DC powered system.
References
[1] US Department of Energy, “The history of the light bulb”, 2013 [Online]. Available: https://www.energy.gov/articles/history-light-bulb [Accessed Feb. 3, 2018]
[2] Natural Resources Canada, “External Power Supplies – May 2016”, 2016 [Online]. Available: https://www.nrcan.gc.ca/energy/regulations-codes-standards/18443 [Accessed Feb. 10, 2018]
[3] Digi-Key Corporation, “Efficiency Standards for External Power Supplies”, CUI Engineering, August 6, 2015 [Online]. Available: https://www.digikey.com/en/articles/techzone/2015/aug/efficiency-standards-for-external-power-supplies [Accessed Feb. 12, 2018]
[4] Canadian Center for Occupational Health and Safety, “Lighting ergonomics – light flicker”, 2018 [Online]. Available: https://www.ccohs.ca/oshanswers/ergonomics/lighting_flicker.html [Accessed Feb. 15, 2018]
[5] US National Library of Medicine, “Potential Biological and Ecological Effects of Flickering Artificial Light”, Justin G. Boyles, May 29, 2014 [Online]. Available: https://www.ncbi.nlm.nih.gov/pmc/articles/PMC4038456/ [Accessed Feb. 16, 2018]
[6] Richtek Technology Corporation, “How to measure light flicker in LED lamps”, 2016 [Online]. Available: https://www.richtek.com/en/Design%20Support/…/LED_light_flicker_design_tip.pdf [Accessed Feb. 20, 2018]
[7] LED Professional, Flicker: standards and test methods”, Jan 19, 2017 [Online]. Available: https://www.led-professional.com/resources-1/articles/flicker-standards-and-test-methods [Accessed Sep. 19, 2018]
[8] eldoLED, “Flicker performance in LED lighting”, June 30, 2016 {Online]. Available: https://www.eldoled.com/support/learning-center/flicker-performance-in-led-lighting/ [Accessed Sep. 19, 2018]
[9] US Department of Energy, “Energy efficiency of white LED’s”, June 2009 [Online]. Available: https://www.fcgov.com/utilities/img/site_specific/uploads/led-efficiency.pdf [Accessed Sep. 4, 2018]