In-depth Assessment of OLED Display Quality
Pierre M. Boher and Thierry Leroux
Organic LEDs (OLEDs) are an interesting and promising new display technology. They provide a number of major technology enhancements for displays and televisions, such as high contrast ratio, wide viewing angle, and very fast response time. Nevertheless, like other display technologies, OLEDs require very good manufacturing control to achieve optimized and homogeneous emissive properties.1, 2 For instance, the multilayer structure of OLEDs can cause colour shifts that depend on the viewing angle, and in some cases inhomogeneity of the active layers within the display can also produce local colour ‘mura’ (Japanese for ‘unevenness’) defects. Local intensity fluctuations produce a kind of blurring for the observer. Long-range colour fluctuations can produce uneven colour, more visible on large television displays than on smartphone screens.
Standard evaluation of OLEDs considers their colour and luminance, but we are the first to evaluate their spectral emission. We used two multispectral measurement systems: a viewing angle system and a multispectral imaging system (see Figure 1). The viewing angle system (the EZContrastMS, developed by ELDIM) is based on Fourier optics and was first introduced in 2008 to characterize LCDs.3 It allows rapid and accurate spectral and angular measurements of small spots on the display surface. The multispectral imaging system (the UMasterMS, also developed by ELDIM) gathers spectral radiance for all image pixels.4Both systems use 31 band-pass filters evenly distributed across the visible range. We used the systems to examine the quality of a curved cellphone (LG F340S G Flex) polymer-OLED display with 720 × 1280 resolution. As with all other OLEDs, the structure of each subpixel is composed of an emissive layer sandwiched between anode and cathode layers. The colour of the emitted light depends on the nature of the emissive layer and the thickness of all the layers.
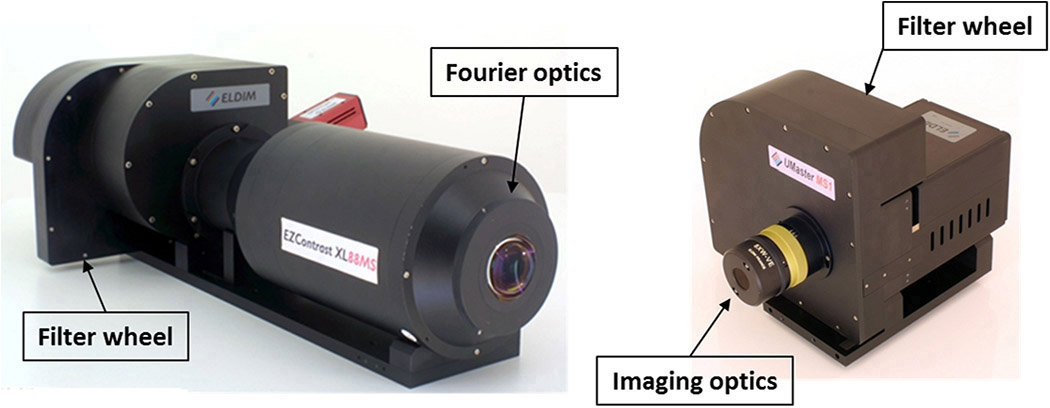 Figure 1. EZContrastMS viewing angle instrument (left) and UMasterMS imaging instrument (right) developed by ELDIM.
We measured the angular and spectral emission of red, green, and blue states at the centre of the cellphone display. Near each colour’s maximum radiance, spherically symmetric fringes appear on the angular spectral radiance patterns, and we can calculate the resulting colour shifts. The amplitude and angular position of these fringes depends on the subpixel type. When averaged over all the azimuths (incident angles from the normal to the surface), the interference fringes appear very clearly (see Figure 2). This set of large interference fringes with strong modulation appears for all OLED displays and corresponds to a structure of micron-thick layers. Nevertheless, a detailed knowledge of the OLED structure is necessary to extract precise structural information from these measurements.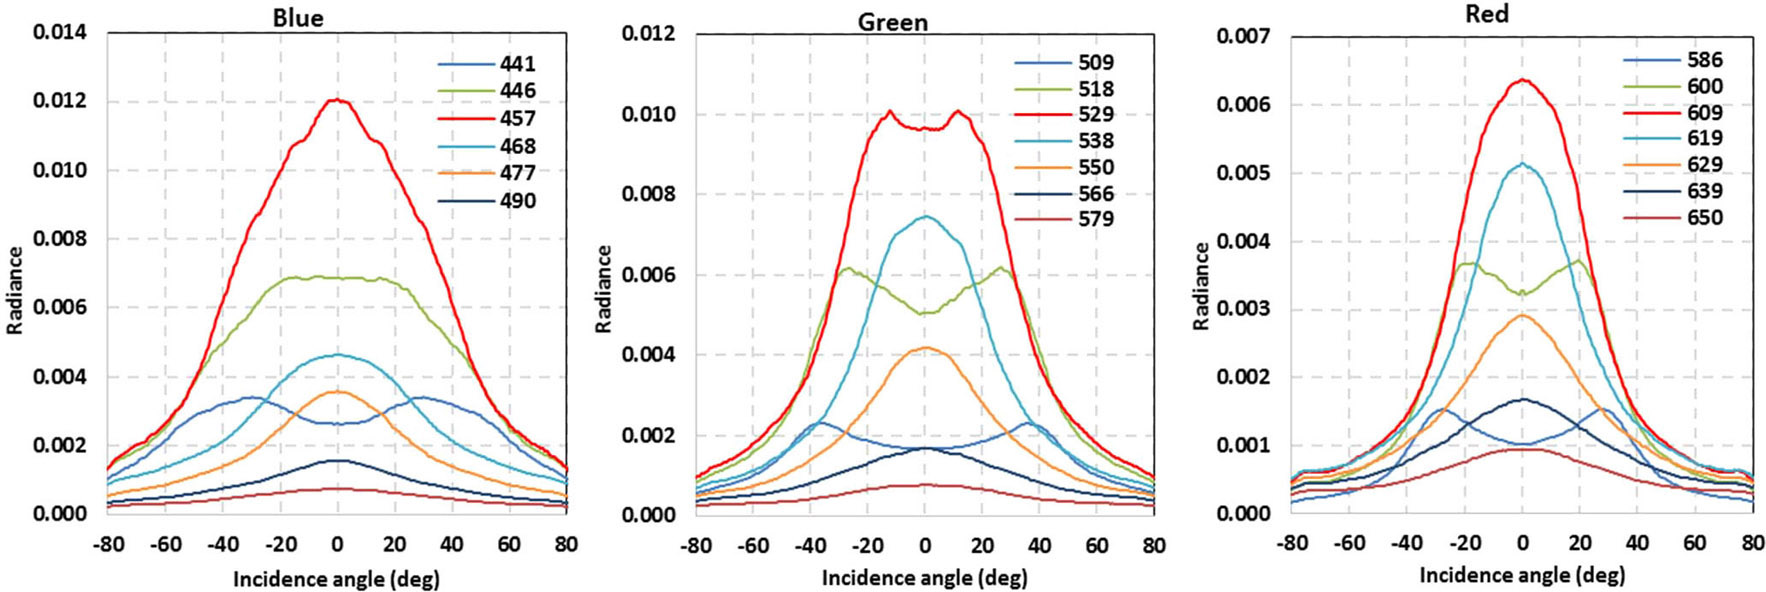 Figure 2. Radiance measured versus angle and at different wavelengths (labeled, in nm) for blue, green, and red states of the polymer organic LED (OLED) display.
To check whether these colour angular variations are visible to the human eye, we considered the variations of colour coordinates in the CIE 1931 (a way of plotting colour composition) xy chromatic plane (see Figure 3). Compared to the ‘MacAdam’ ellipses (which give an idea of human eye sensitivity at the different locations of the plane), it is clear that these angular variations are easily discernible for all three subpixel types.

Figure 3. Colourbehavior in the CIE 1931 (a colour composition standard) chromatic plane for polymer-OLED displays: MacAdam ellipses (which give an idea of human eye sensitivity to colour) are also reported (size multiplied by 10).
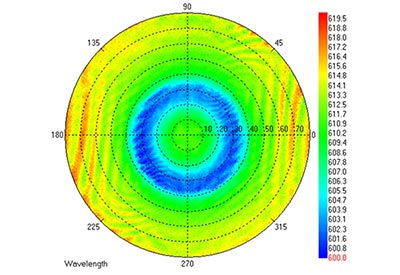
To analyze the spectral measurements more precisely, we can adjust the emission peaks using a double Gaussian model, taking into account the peak intensities, the peak wavelengths, and the spectral bandwidths.5 This adjustment is a way to emphasize the interference fringe pattern and obtain physical parameters. We applied the fitting procedure to all the viewing angles. Figure 4 reports wavelength position and band-pass results for the red state in the Fourier (angular) plane. The centre is for normal incidence, and the different circles represent different incident angles. In addition to the interference fringes reported above, both wavelength and band pass (or full width at half-height of a Gaussian peak) exhibit a complex fringe pattern similar to a polarization pattern produced by birefrigent layers and probably due to the top layer structure.
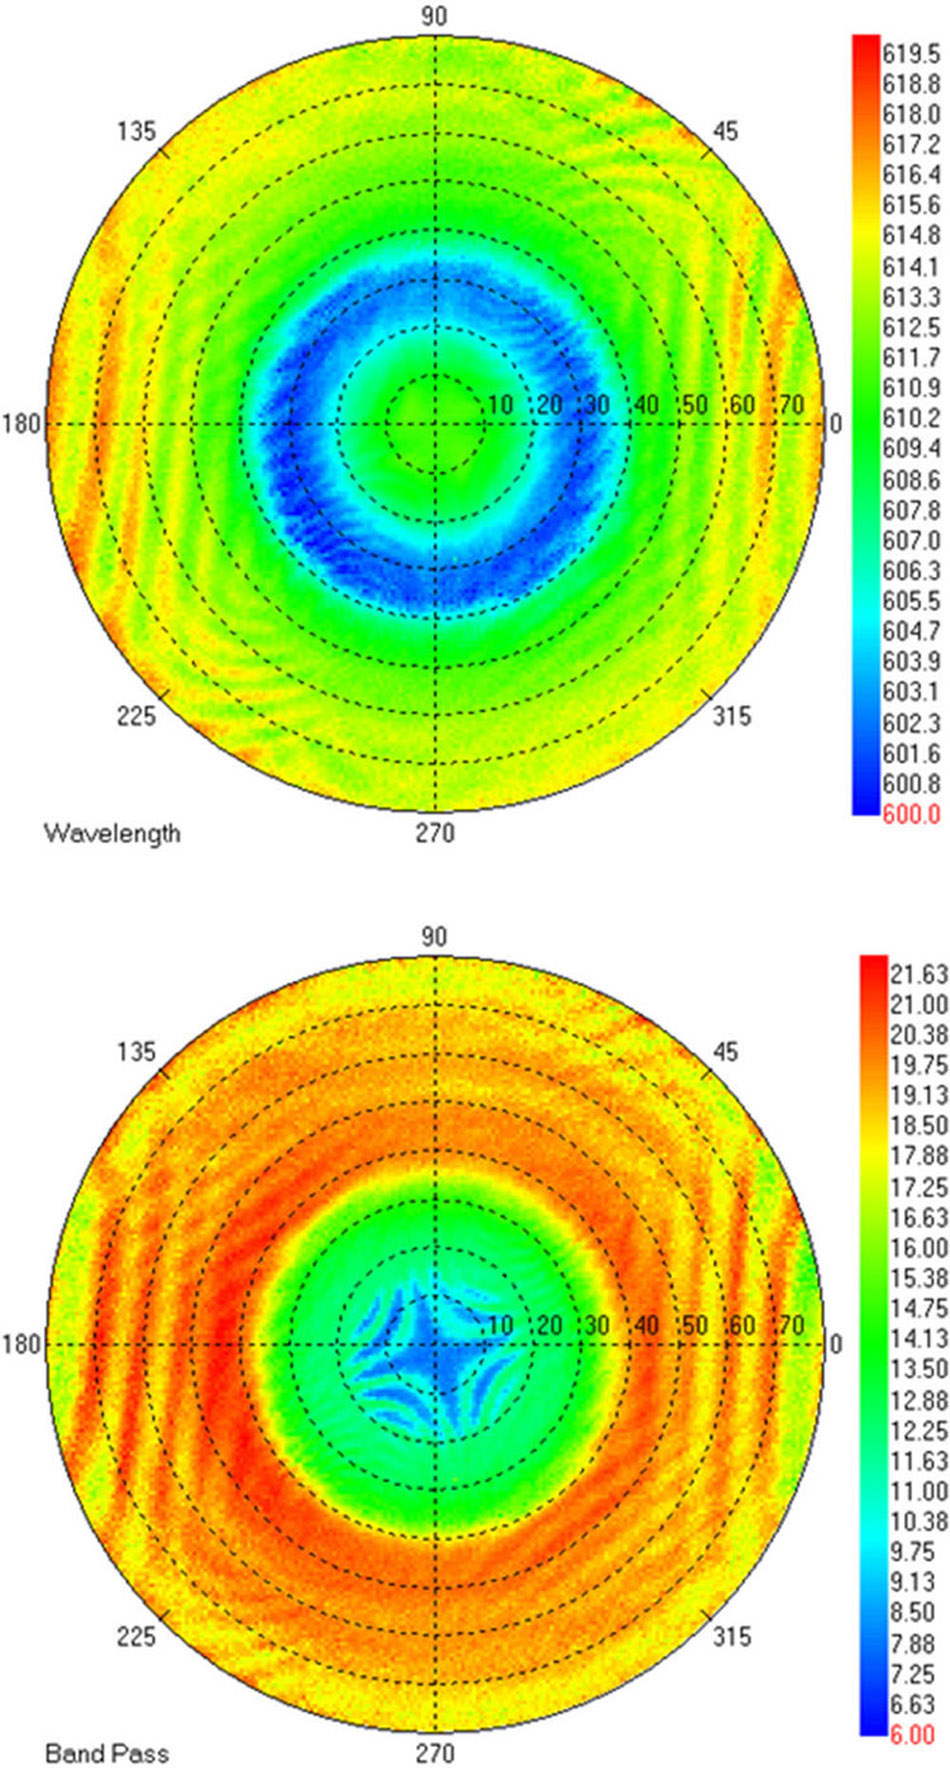 Figure 4. Wavelength position (nm, above) and band pass (nm, below) of the polymer-OLED display, shown by the colour scale, for the red state obtained with a double Gaussian adjustment.
We performed two types of spectral imaging measurements. First, we measured the entire surface of the display using 8° angular aperture imaging optics. The emission was analyzed using 234 = 18 × 13 spots regularly distributed across the entire display surface and adjusted with the same double Gaussian model as previously.5 Figure 5 (right) shows the homogeneity of the main spectral emission wavelengths at 455, 530, and 610nm. A small gradient of wavelength and radiance is detected along the main size of the display for green and red states. There is no clear gradient for the blue state, but the wavelength variations are significant.

Figure 5. Wavelength of radiance maximum covering the entire display surface (left) and on 14×10 pixels near display centre (right) for blue (top), green (centre) and red (bottom) states on 18×13spots.
Second, we measured the display emission at subpixel level near the centre of the screen using high-spatial-resolution optics on 140 (=14×10) neighbouring subpixels. Figure 5 shows the homogeneity of the main spectral emission wavelengths at 455, 530, and 610nm using the same scales as the full frame measurements. Clearly, local wavelength fluctuations are much smaller than the variations across the entire display. In fact, the main intensity fluctuations can be quantified by the maximum of the main Gaussian peak obtained by the regression. There was no spectral fluctuation. To check the impact of these imperfections, it is useful to compute the different types of colour fluctuations as ΔE values in the CIE 1976 colour plotting system. The different ΔE values for the angular and imaging measurements are shown in Table 1.
Table 1.Colour differences (ΔE) in the CIE 1976 system obtained with the different measurement methods for the three primary colours. Percentage of surface or pixels above the just noticeable difference (2.3) are indicated for the imaging measurements.

In summary, we have found that for smartphone OLED screens, angular shifts above 30° can be discerned by the human eye for all subpixels, and long-range deviations are discernible for green and red states. Local fluctuations are negligible except for blue subpixels, where the imperfections are discernible, producing a kind of blurring for the observer. We are currently considering long-range colour fluctuations, which can produce local mura defects that are easily observed, especially on large television displays. We have made similar measurements of spectral emission from OLED televisions and are currently analyzing them.
Pierre Boher is currently R&D manager at ELDIM, which he joined in 2003. He has an engineering degree and a PhD in physics from Paris VI University. He previously worked at the French Philips Laboratories and was R&D manager at Sopra.Thierry Leroux is the president and CEO of ELDIM, which he founded in 1992. He has an engineering degree and a PhD in physics. He worked at CEA LETI on the development of different types of displays for 10 years before founding ELDIM.
This article was first published online by SPIE(http://spie.org/x10.xml?WT.svl=mddh1), an international not-for-profit society that advances emerging technologies through interdisciplinary information exchange, continuing education, publications, patent precedent, and career and professional growth.
References
1. E. Cooper, H. Jiang, V. Vildavski, F. Farrell, A. Norcia, Assessment of OLED displays for vision research, J. Vision 13(12), p. 23, 2013.
2. P. Boher, T. Leroux, T. Bignon, P. Blanc, Colour display evaluation vs. viewing angle using L*a*b* colour space and Fourier-optics measurements, J. Inf. Display 12(4), p. 179, 2011.
3. P. Boher, T. Bignon, T. Leroux, D. Glinel, P-89: new multispectral Fourier optics viewing angle instrument for full characterization of LCDs and their components, SID Symp. Digest Tech. Papers 39(1), p. 1517-1519, 2008. doi:10.1889/1.3069445
4. P. Boher, T. Leroux, T. Bignon, V. Collomb Patton, Spectral imaging analysis of OLED display light emission properties, Proc. 21st Int’l Disp. Worksh., 2014.
5. K. Man, I. Ashdown, Accurate colourimetric feedback for RGB LED clusters, Proc. SPIE 6337, p. 633702, 2006. doi:10.1117/12.683239